Facebook
 X
X
 Pinterest
 Copy Link

Snohomish Housing Market | February 2026 with Price Point Breakdown
by Brandice Raybourn
Quick Take
This Snohomish housing market update reflects January 2026 activity and shows a market that is slower, more deliberate, and far less forgiving than it was during peak years. Buyers are taking their time, sellers are becoming more realistic, and outcomes depend heavily on price point, condition, and strategy.
January’s numbers reflect a very typical winter slowdown. Nearly all housing types and price points are seeing longer days on market, showing just how patient both buyers and sellers have become. Even so, the market is still functioning, with 47 homes selling in January. One important trend this month is that several higher-priced homes that had been on the market for quite some time finally closed, pushing averages higher across the board.
That is exactly why looking beyond citywide averages matters, especially in a market that has felt uncertain for many.
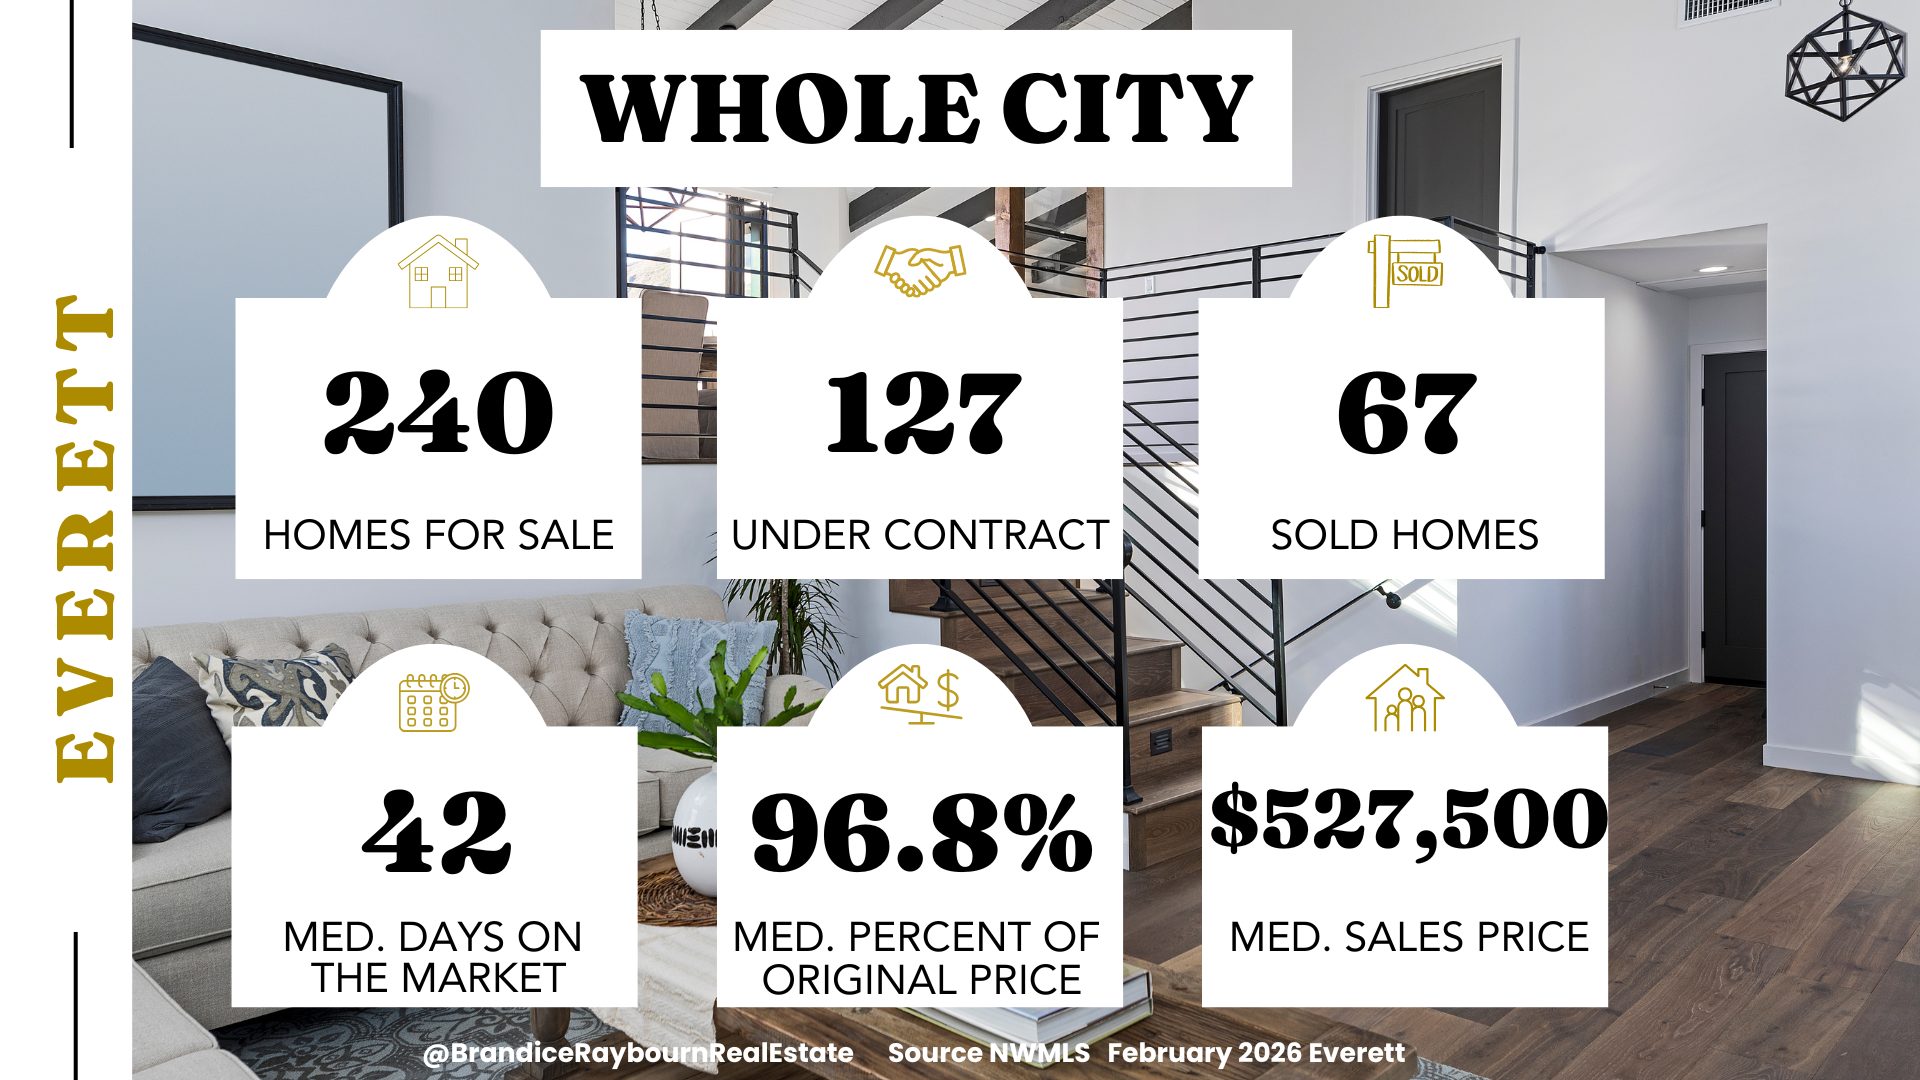
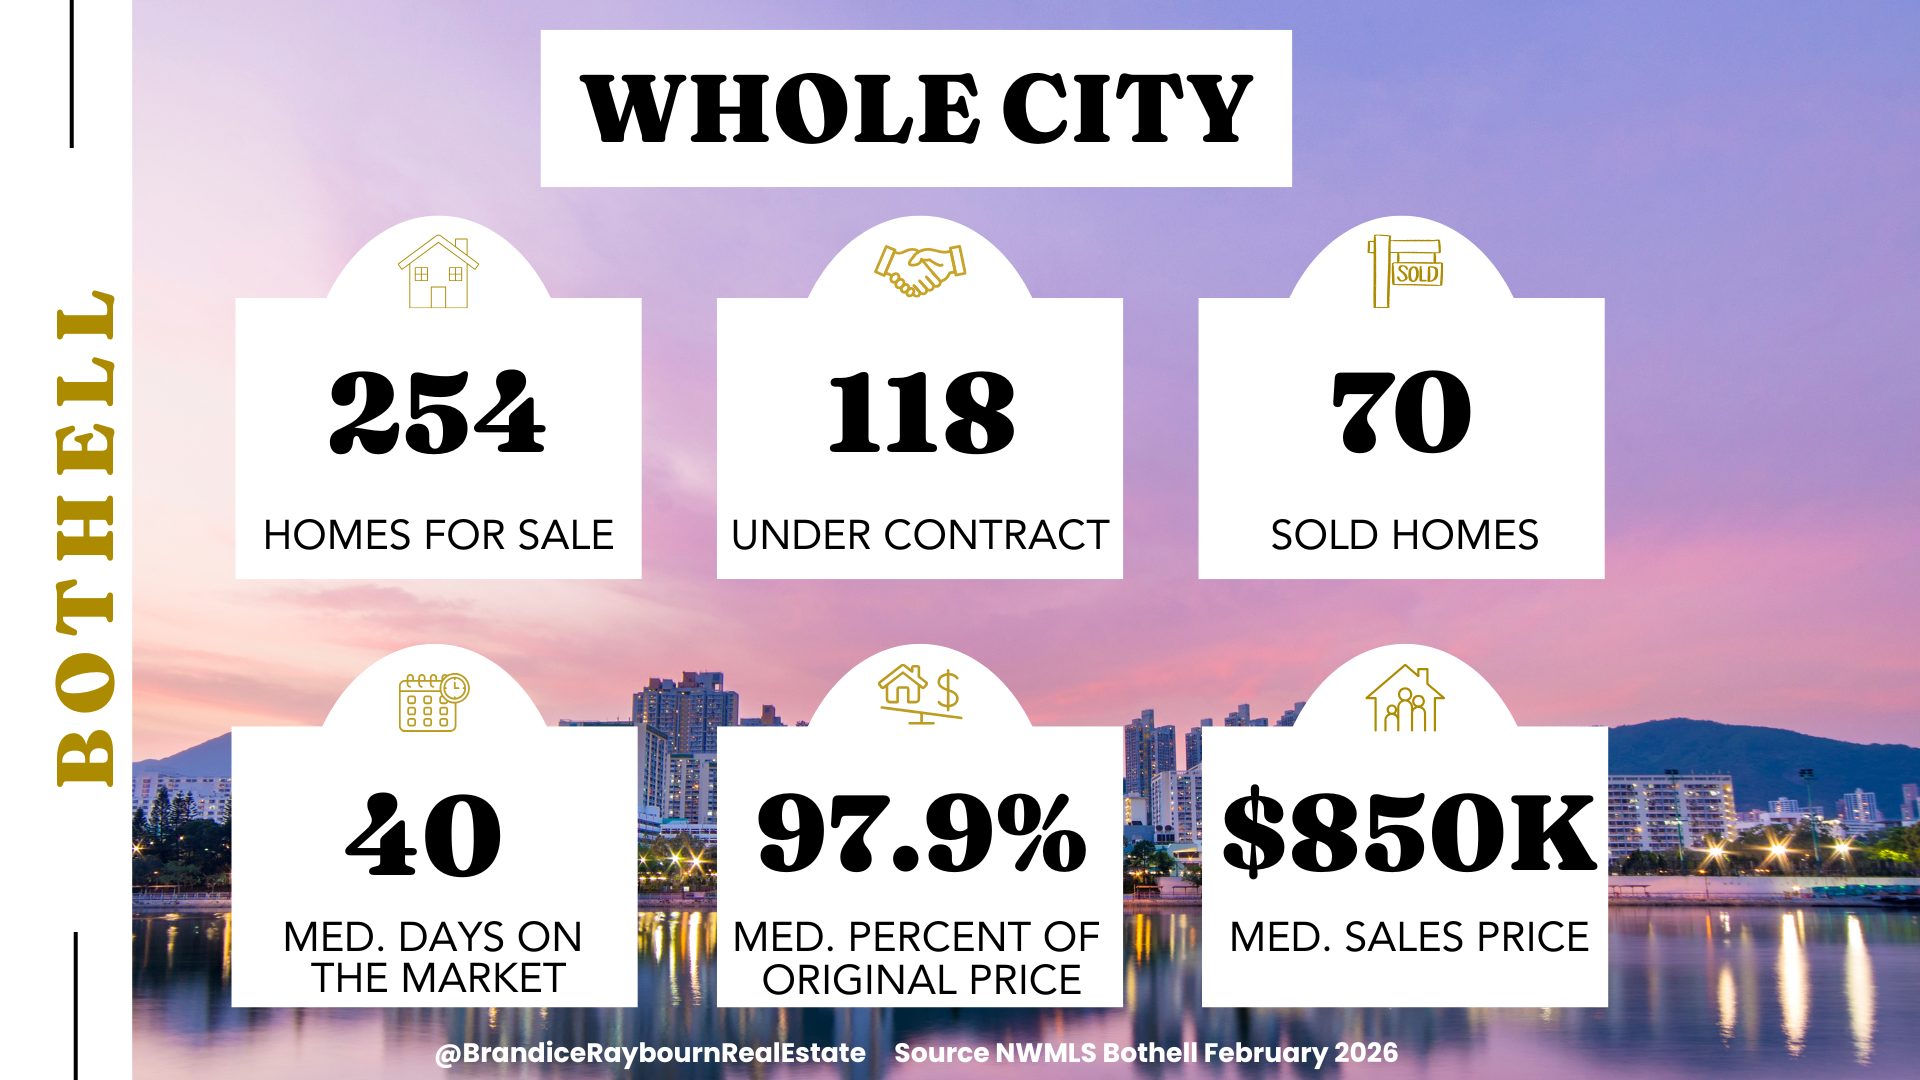
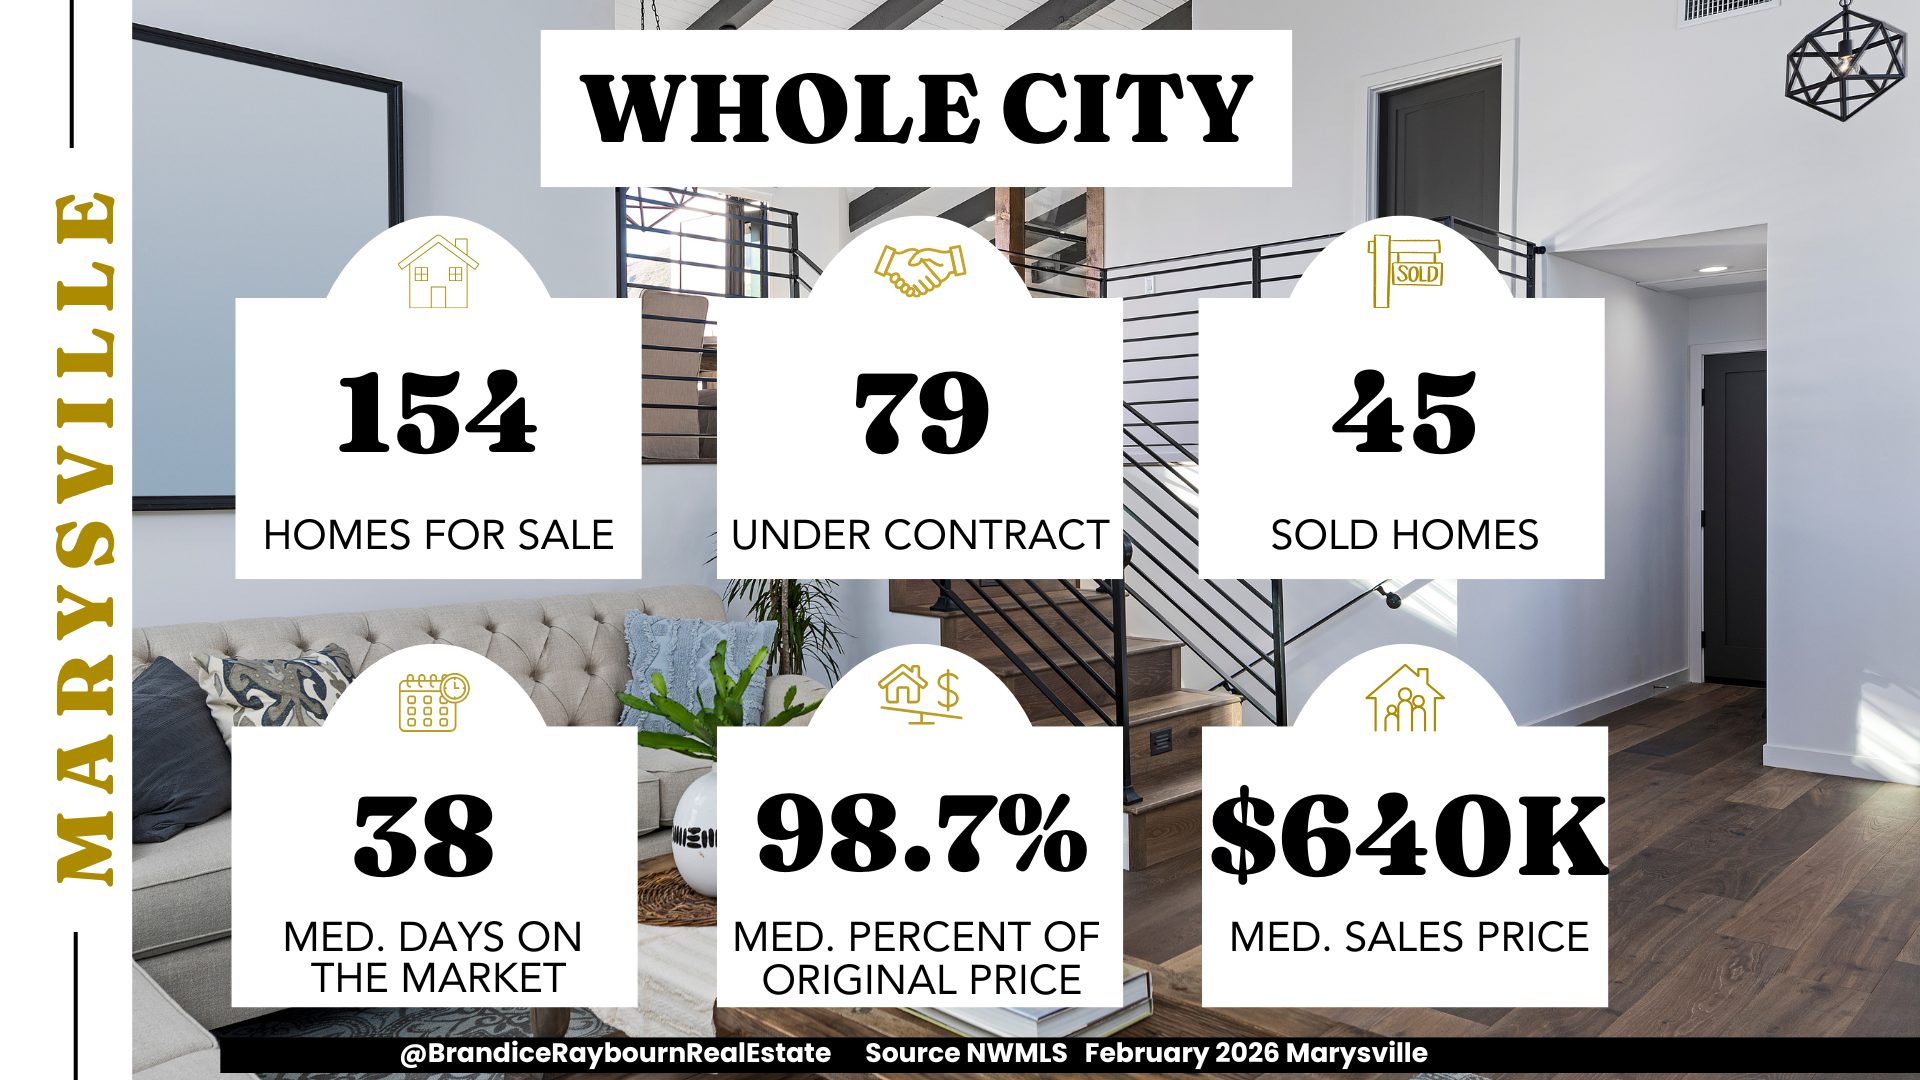
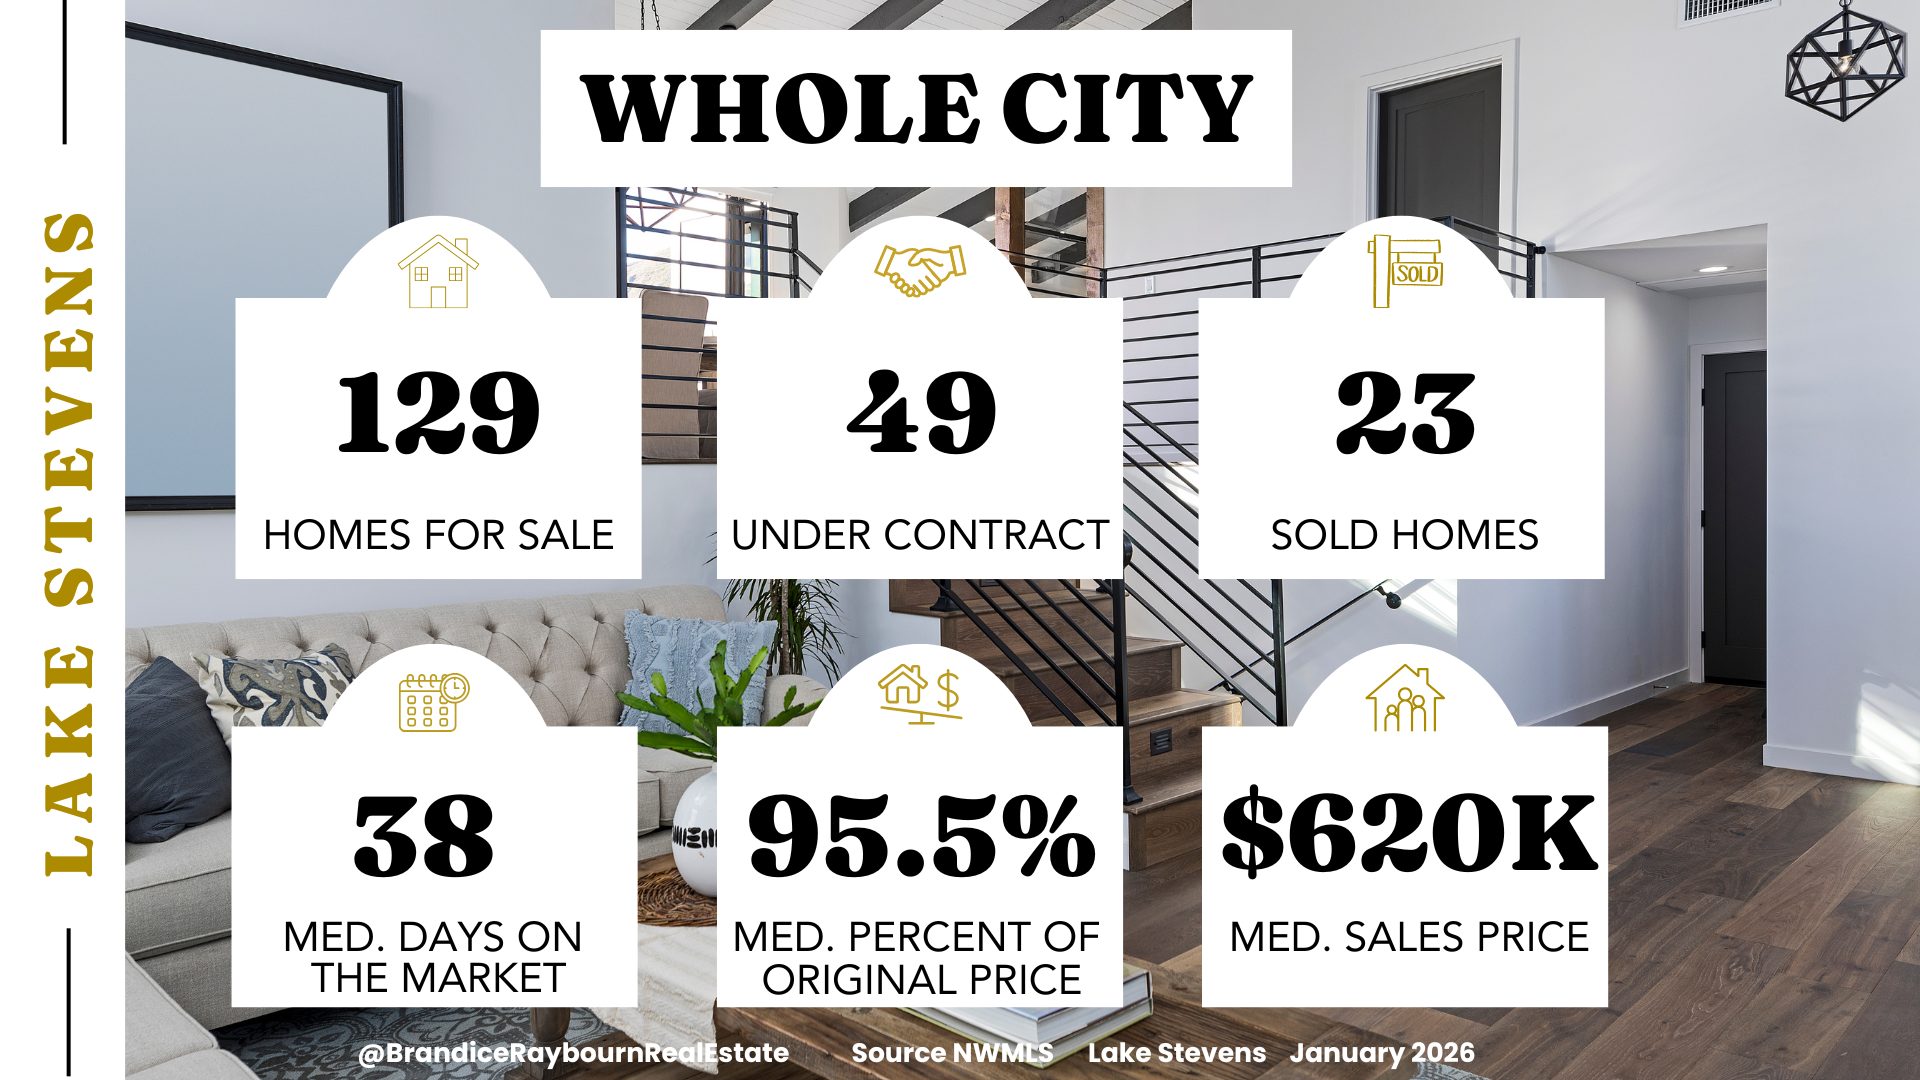
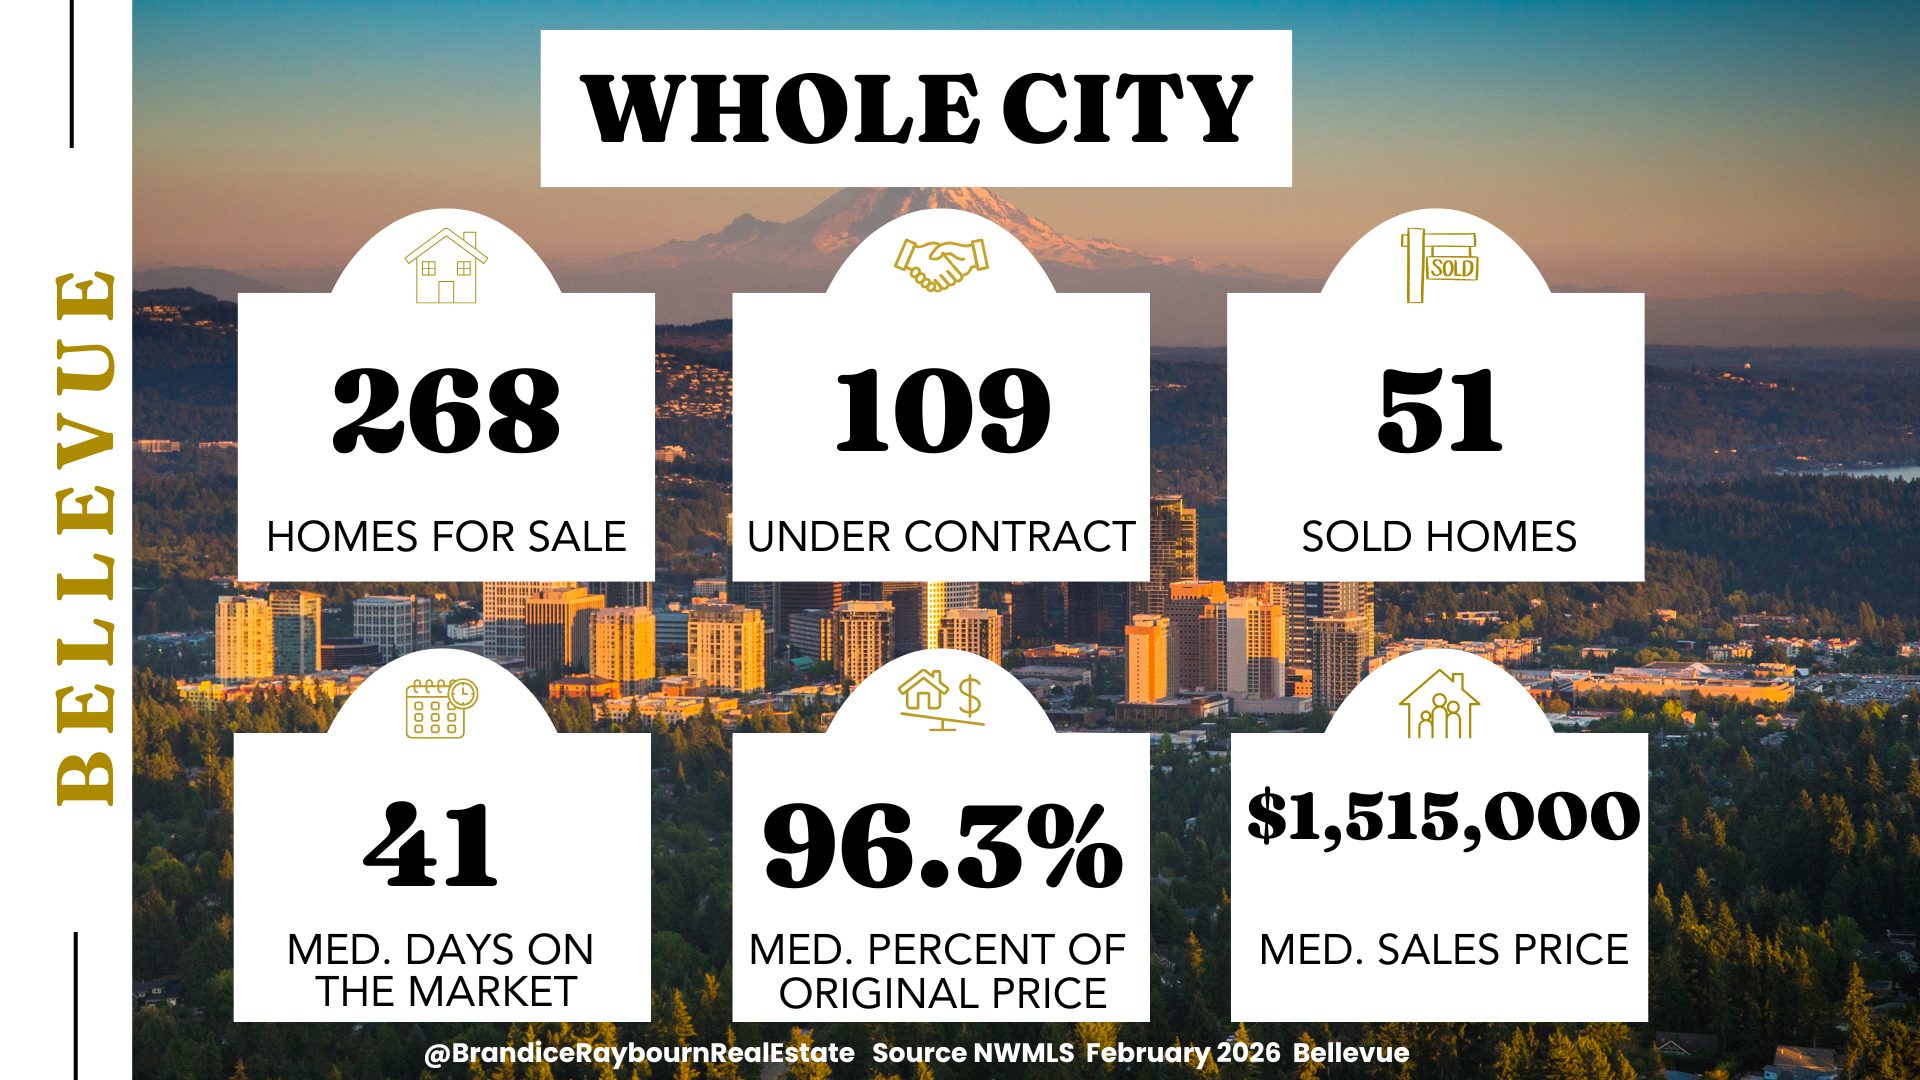
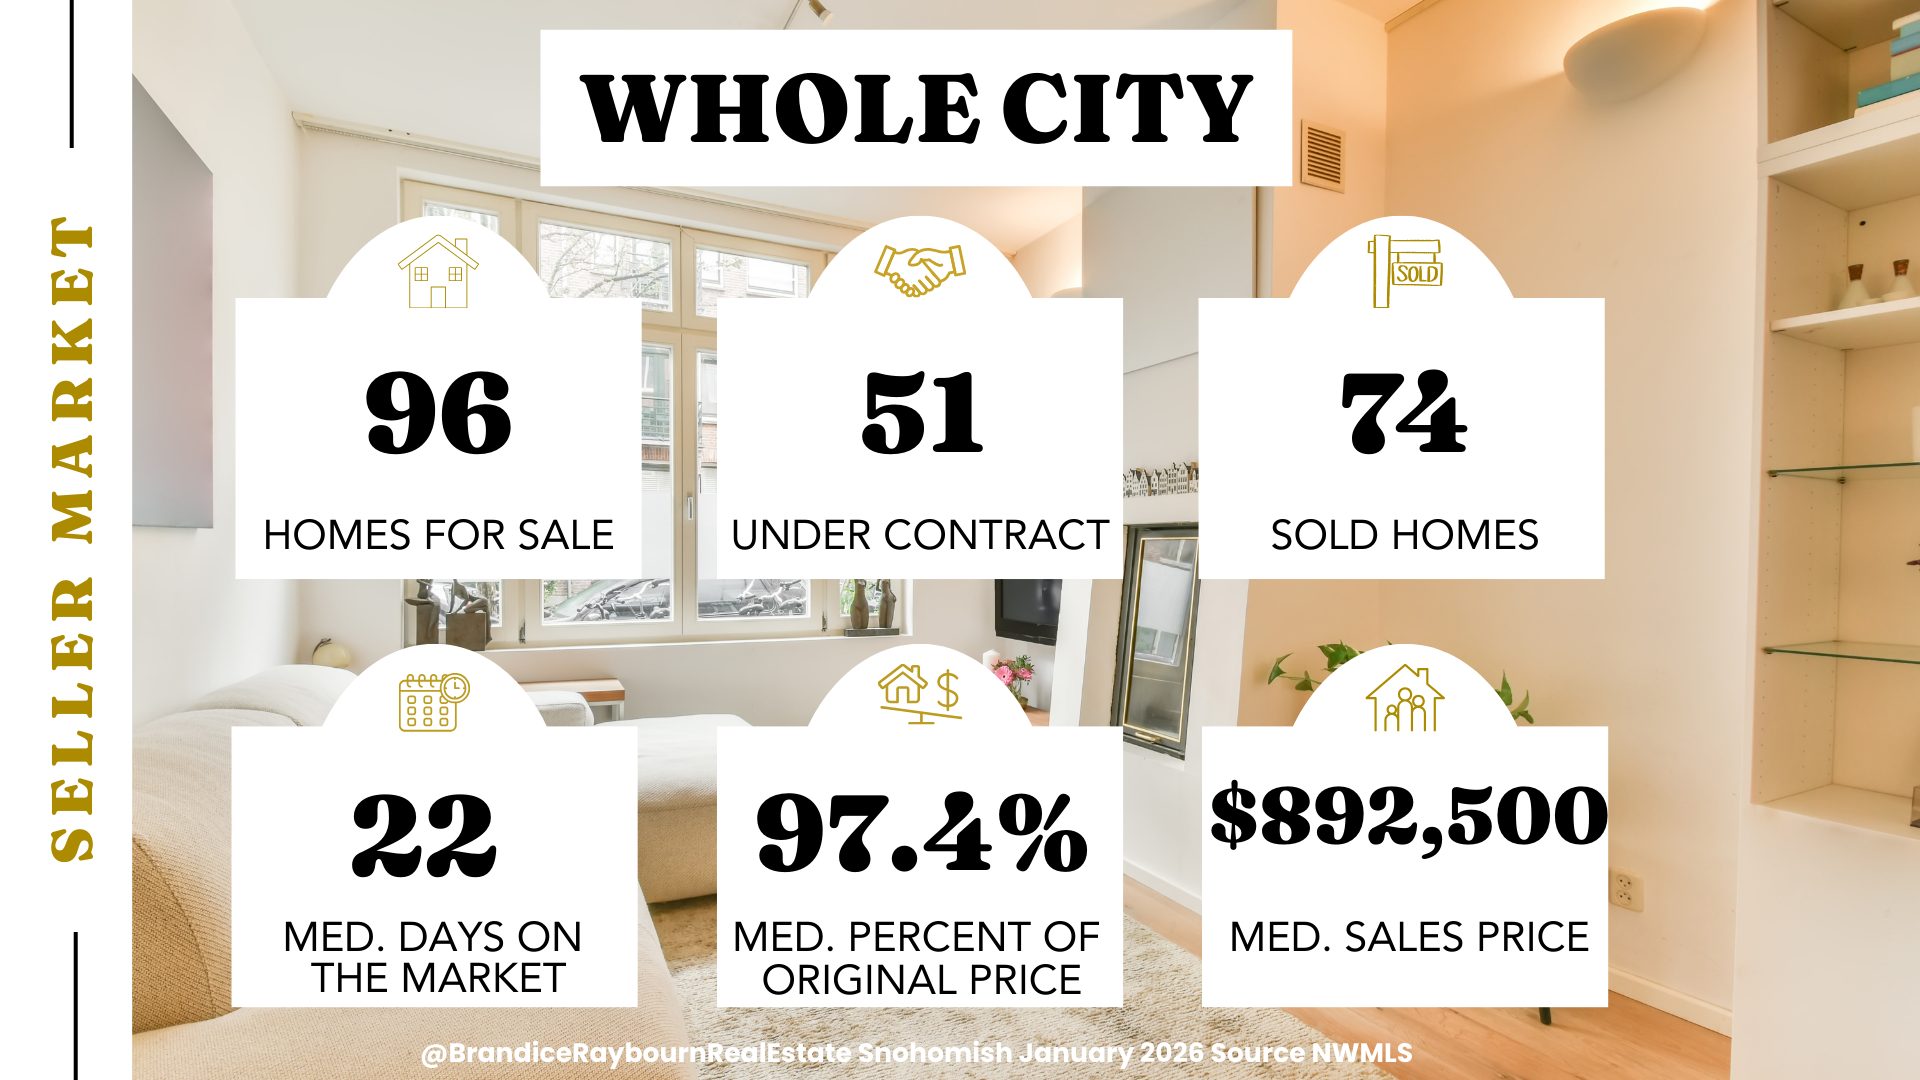
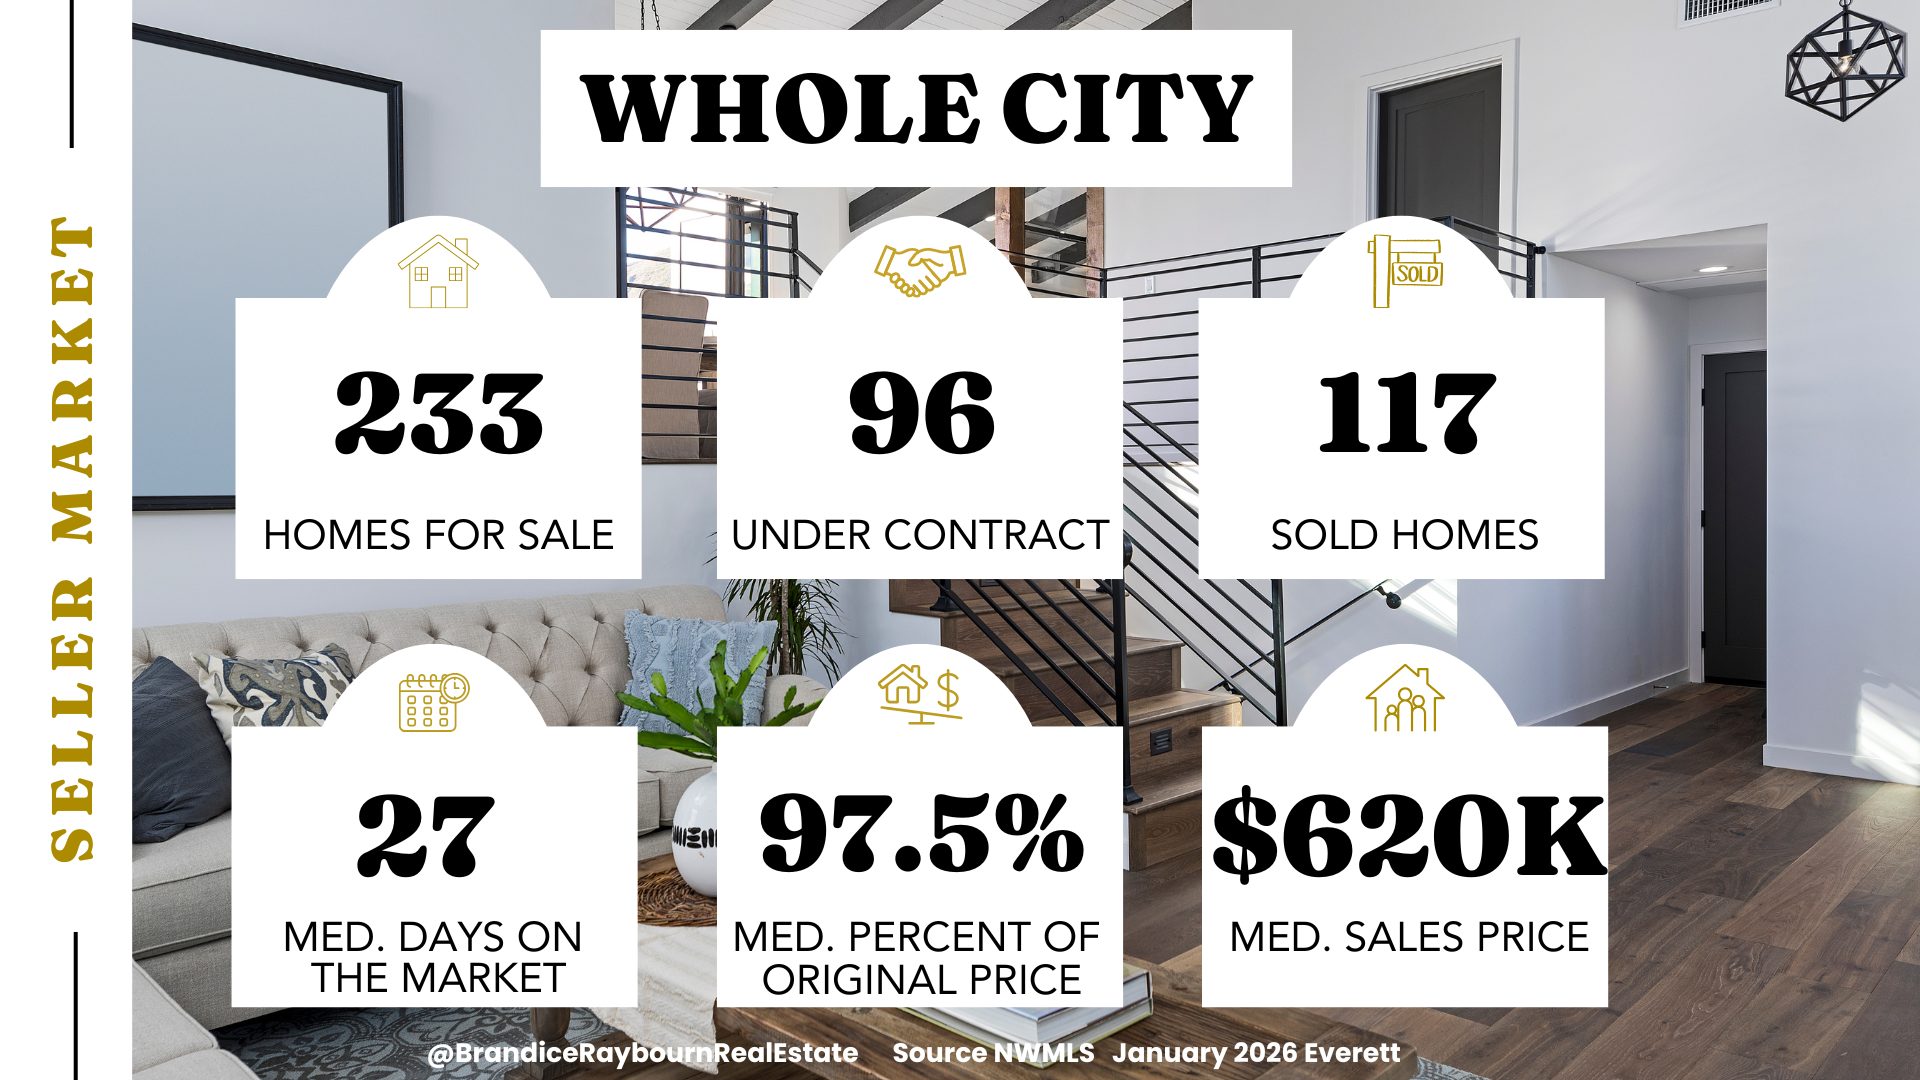
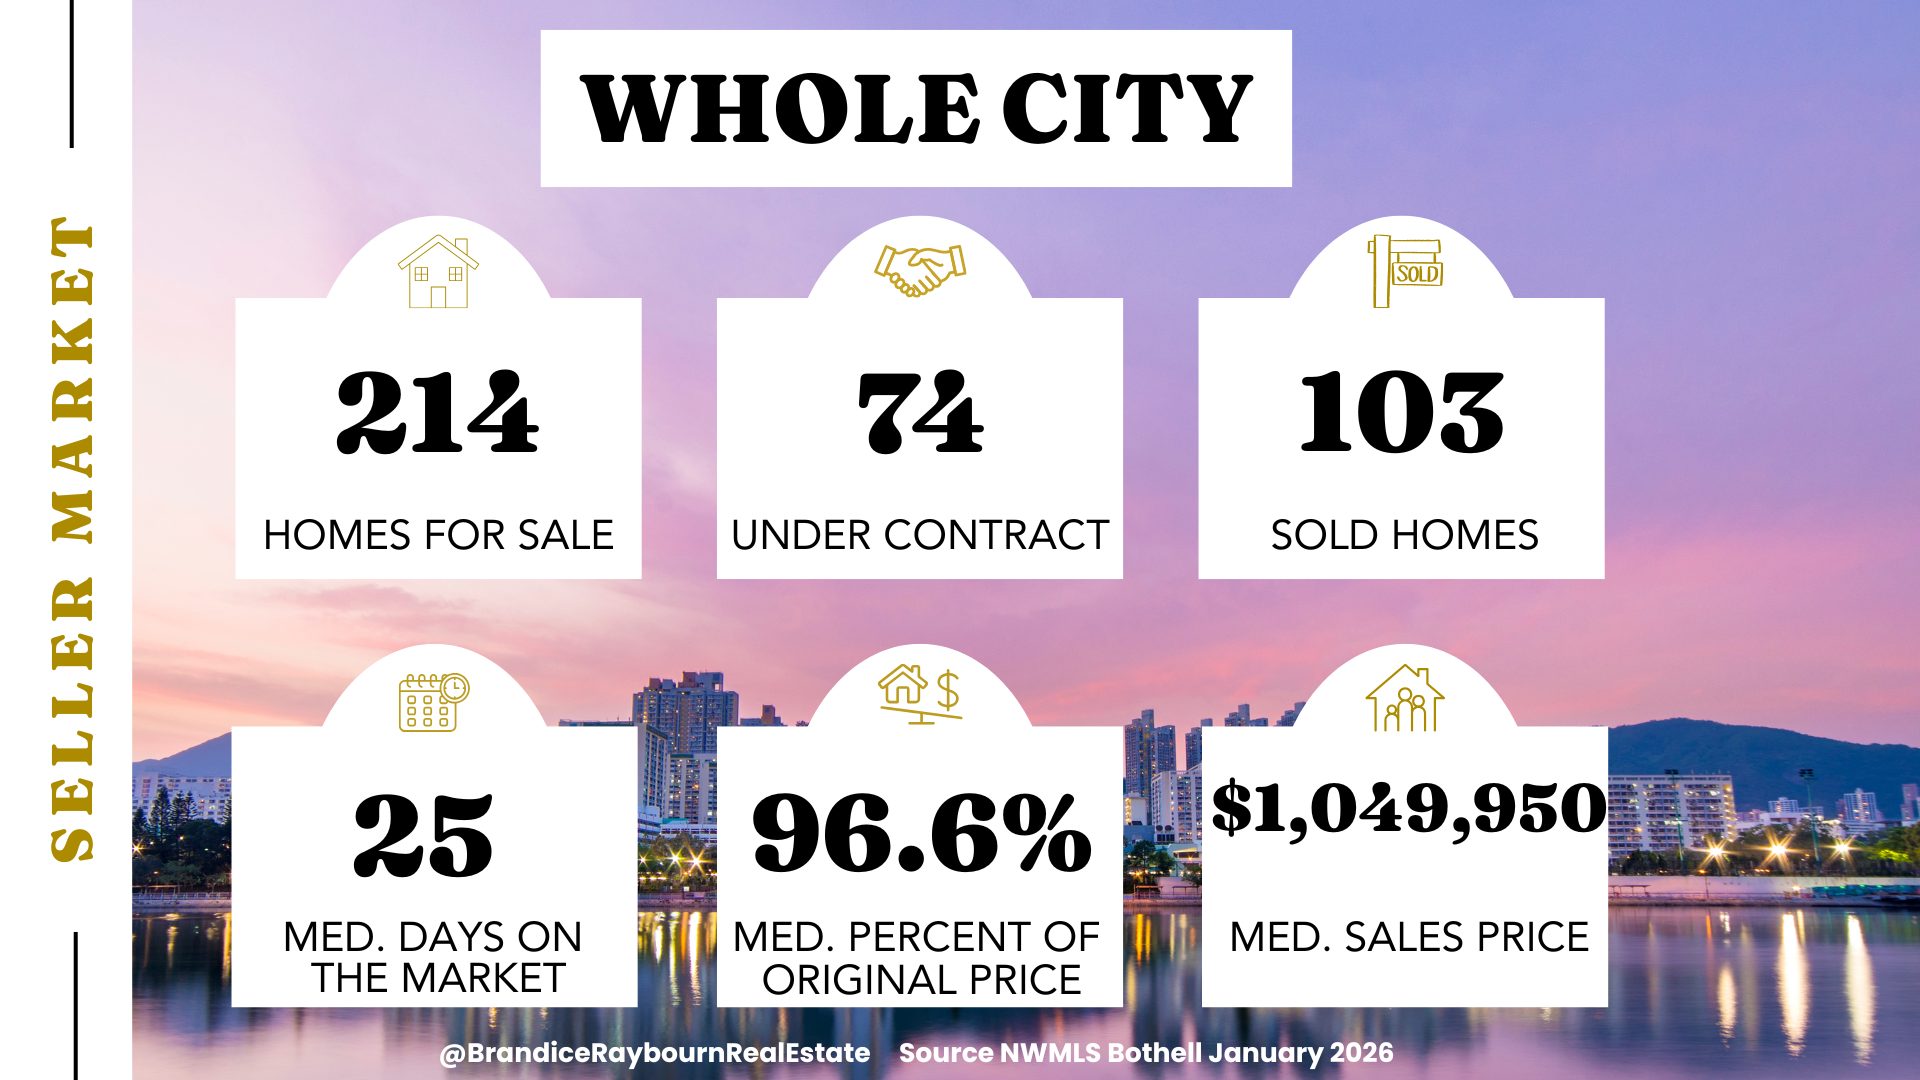
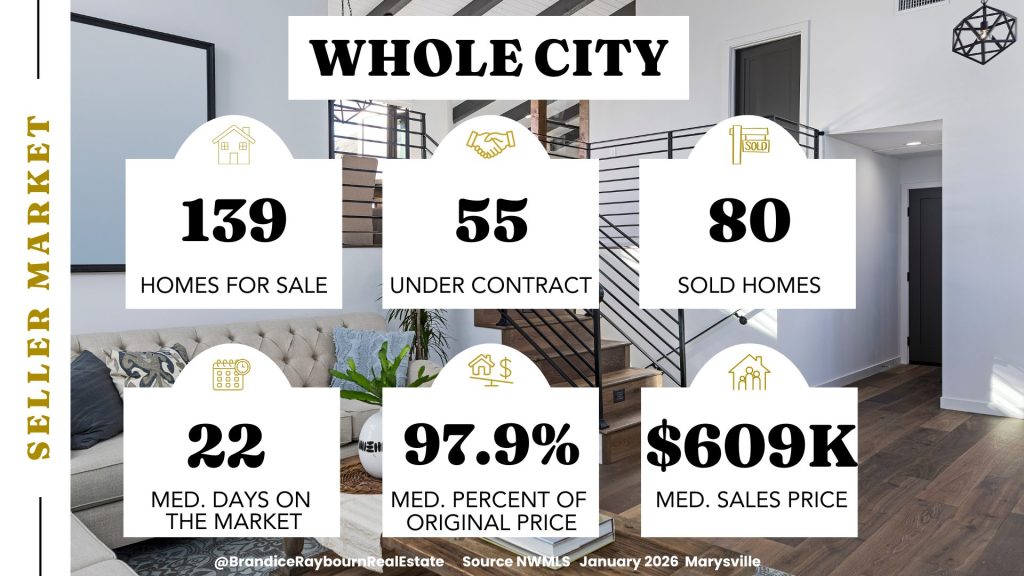
Snohomish Whole City Snapshot
At a high level, Snohomish remains active, but clearly slower. Homes are selling, contracts are being written, and buyers are engaged, but urgency is low. Longer days on market across the city reflect winter seasonality and the fact that many of the homes closing this month had been listed for quite some time.
This is not a stalled market — patience is simply becoming the new norm.
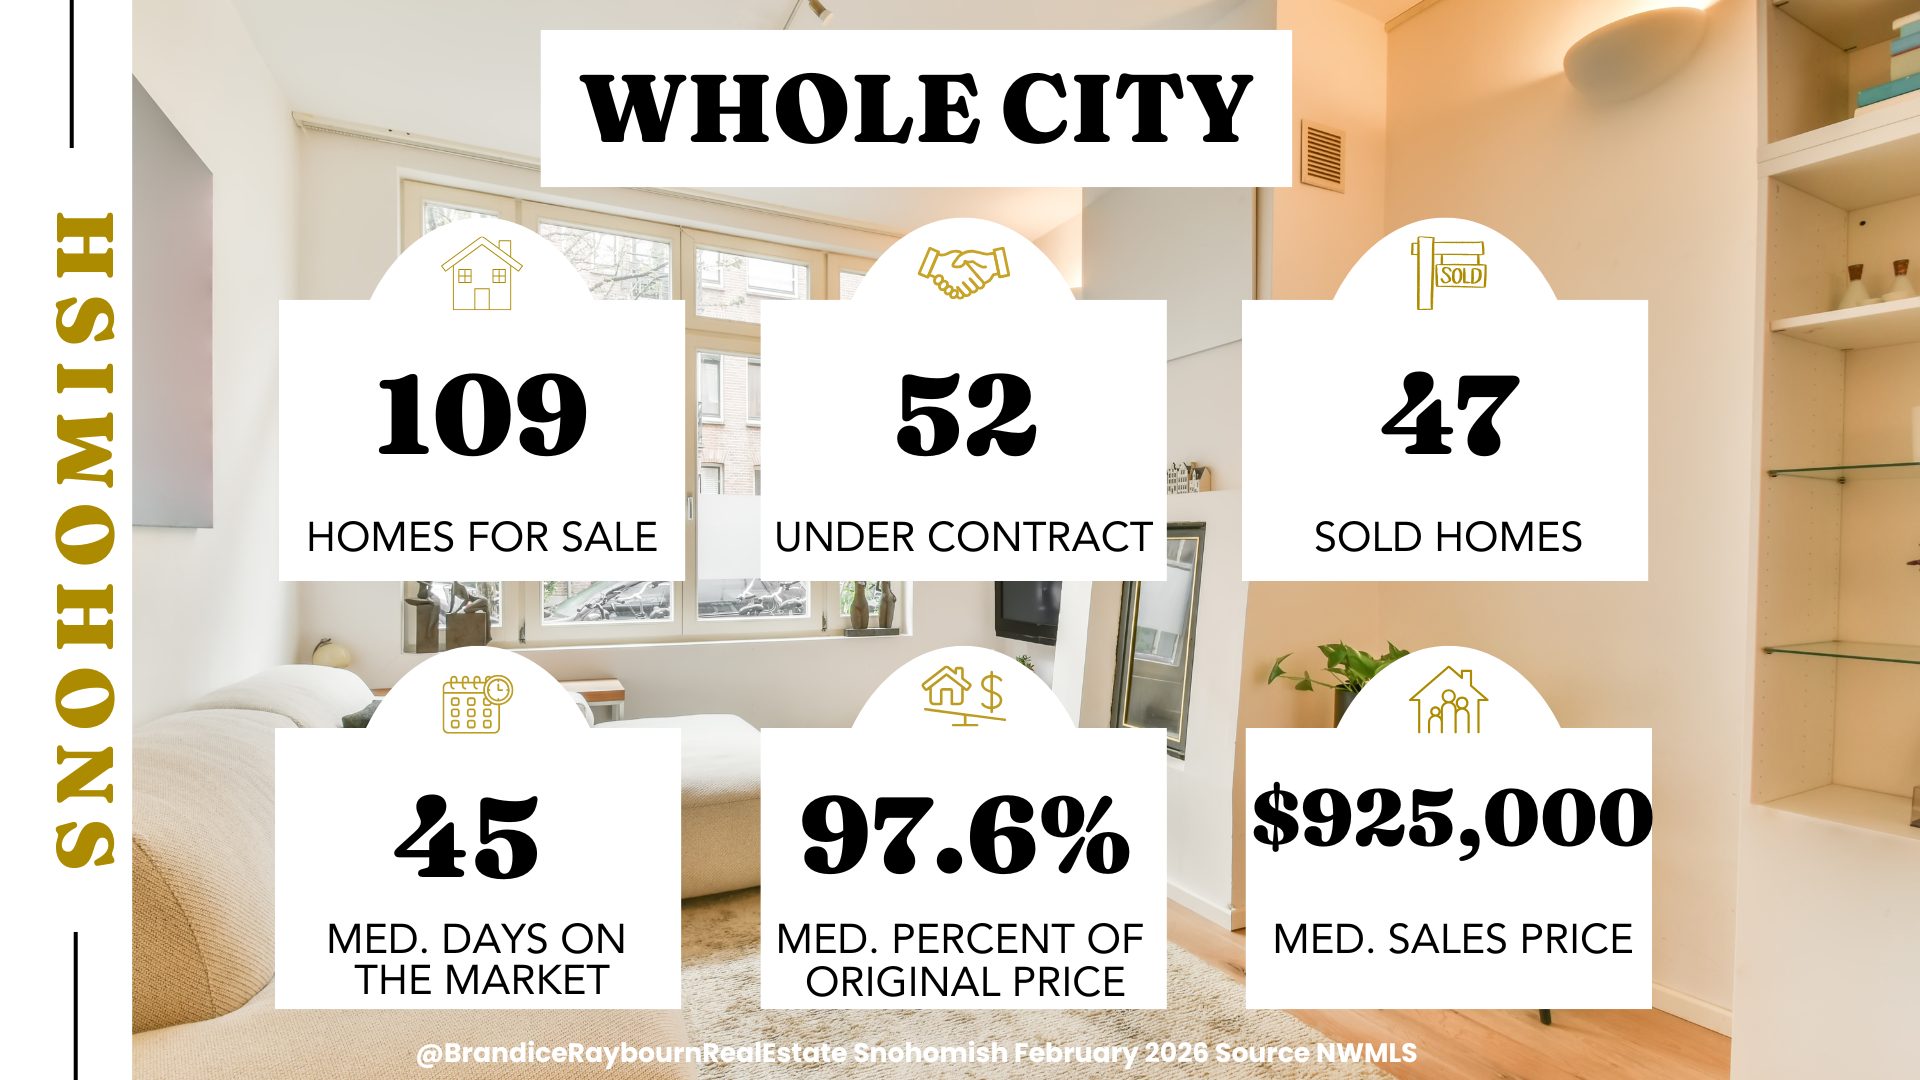
Source: NWMLS | Analysis by Brandice Raybourn
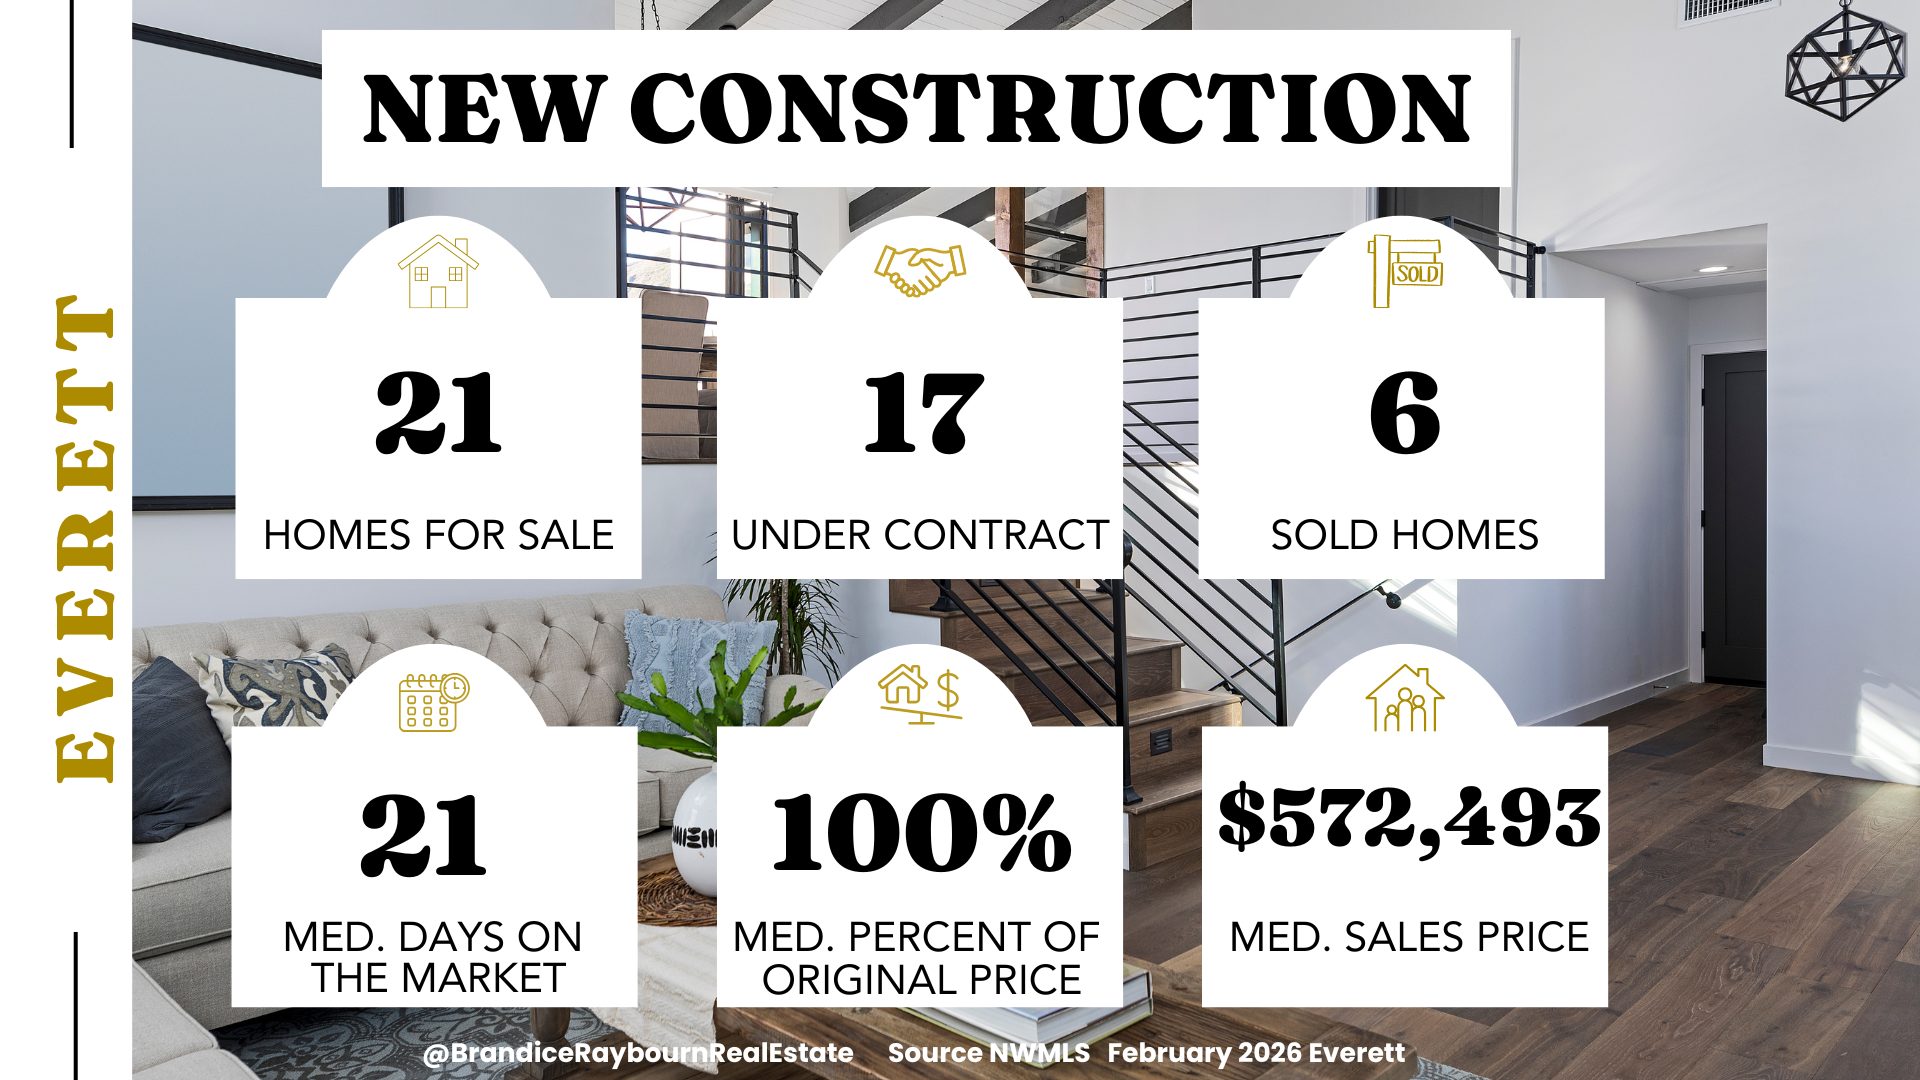
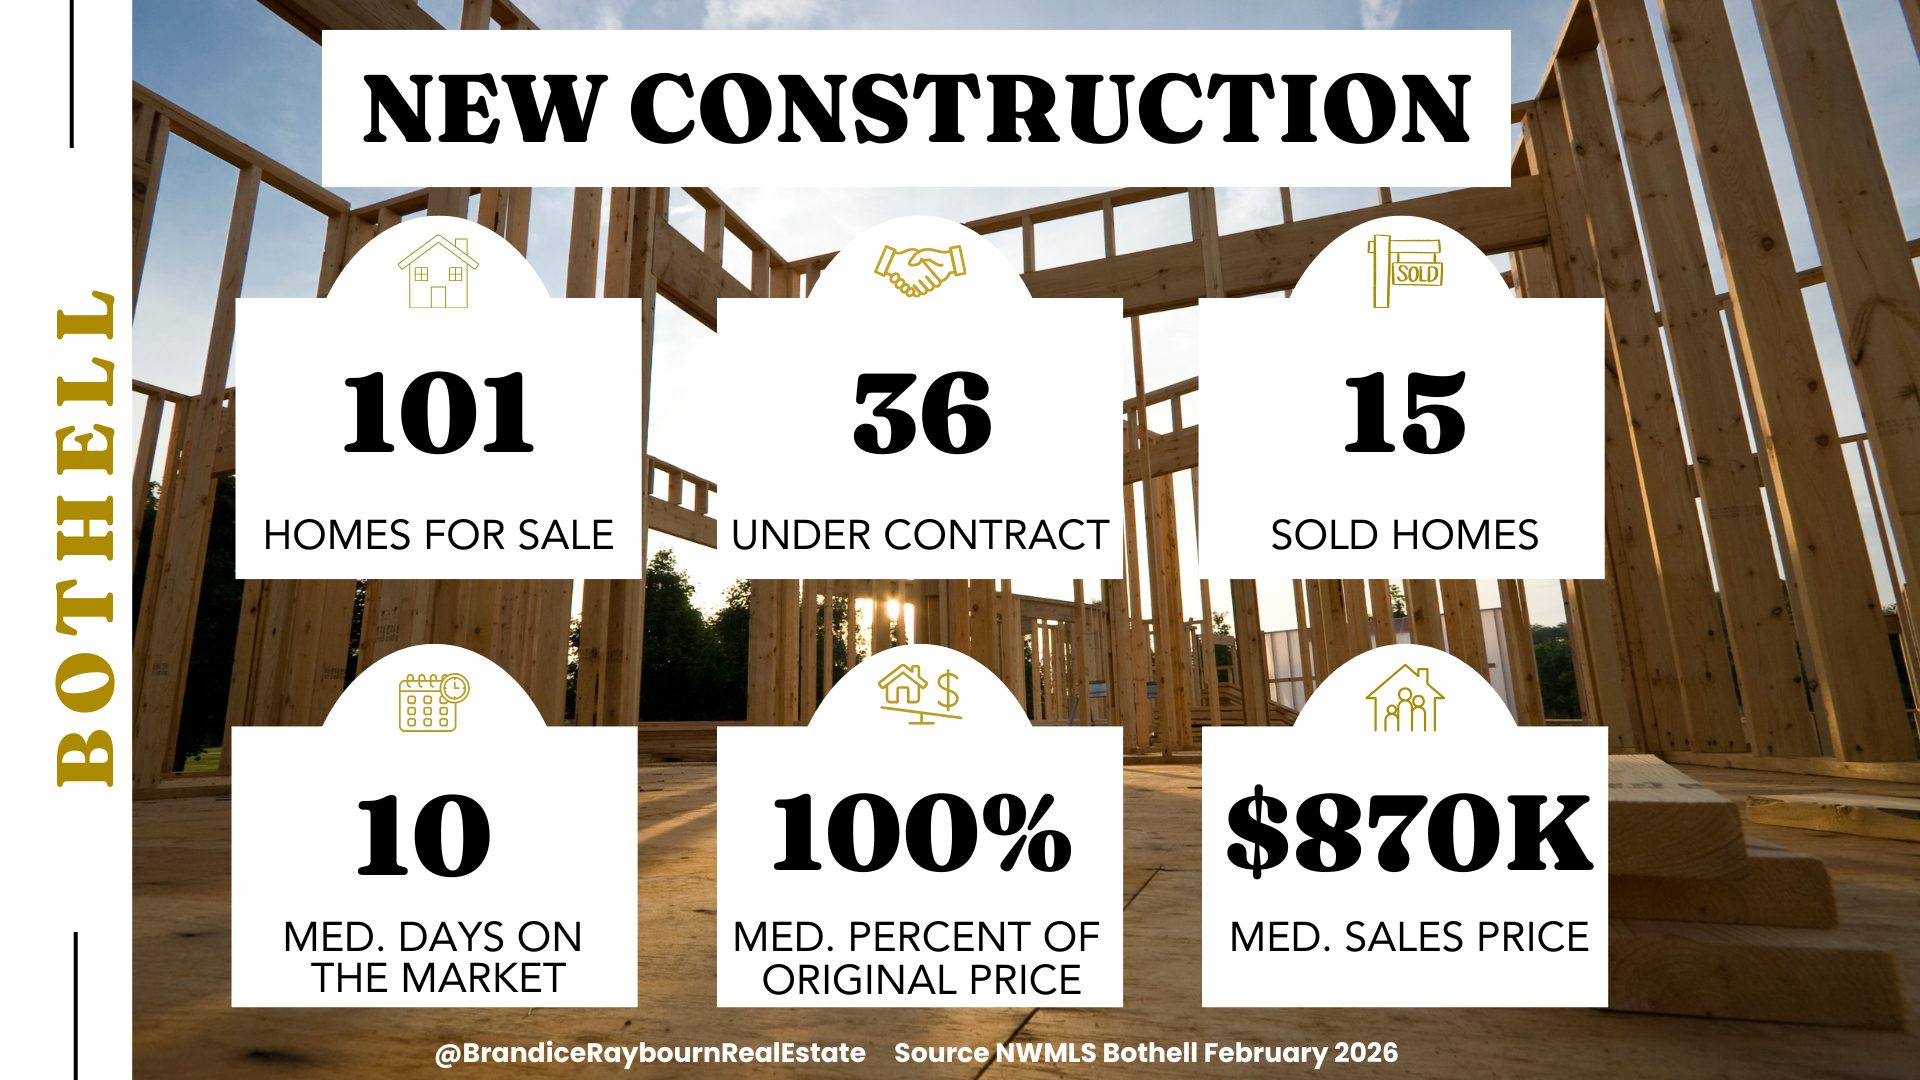
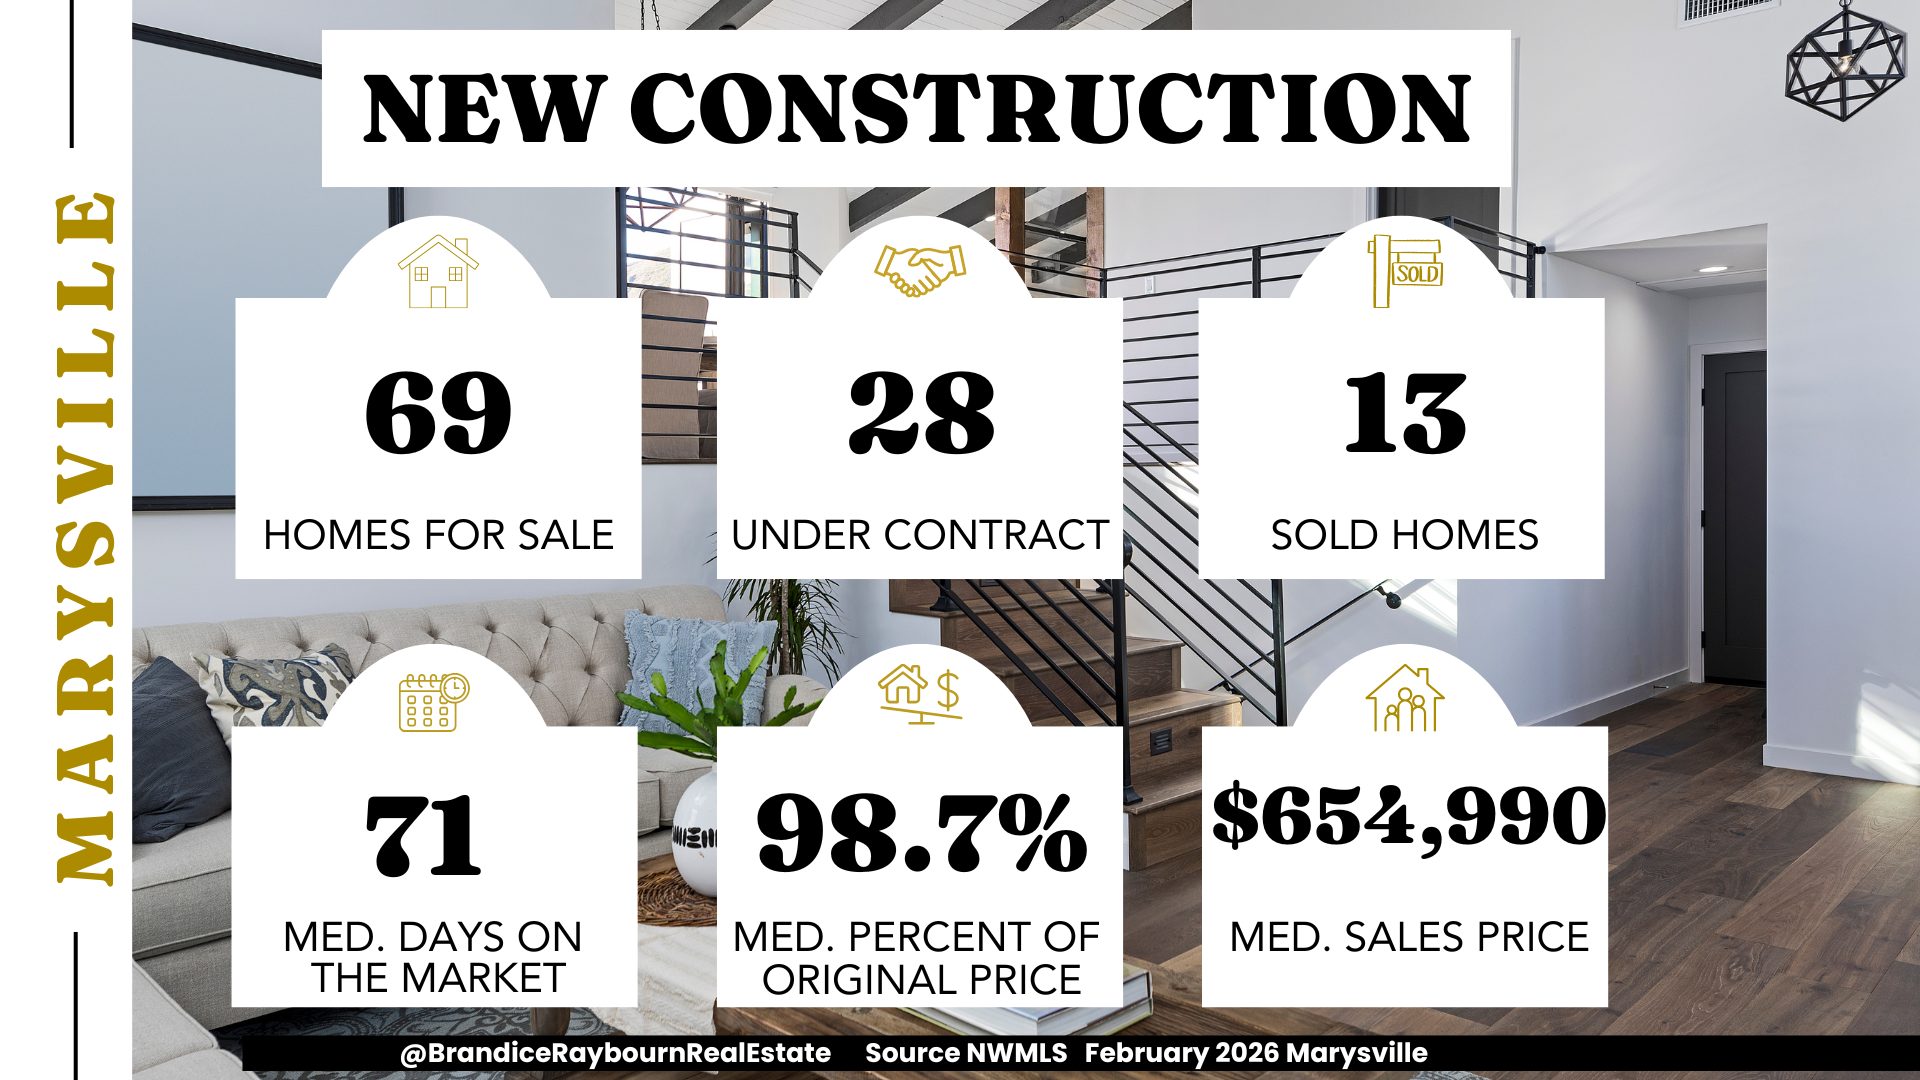
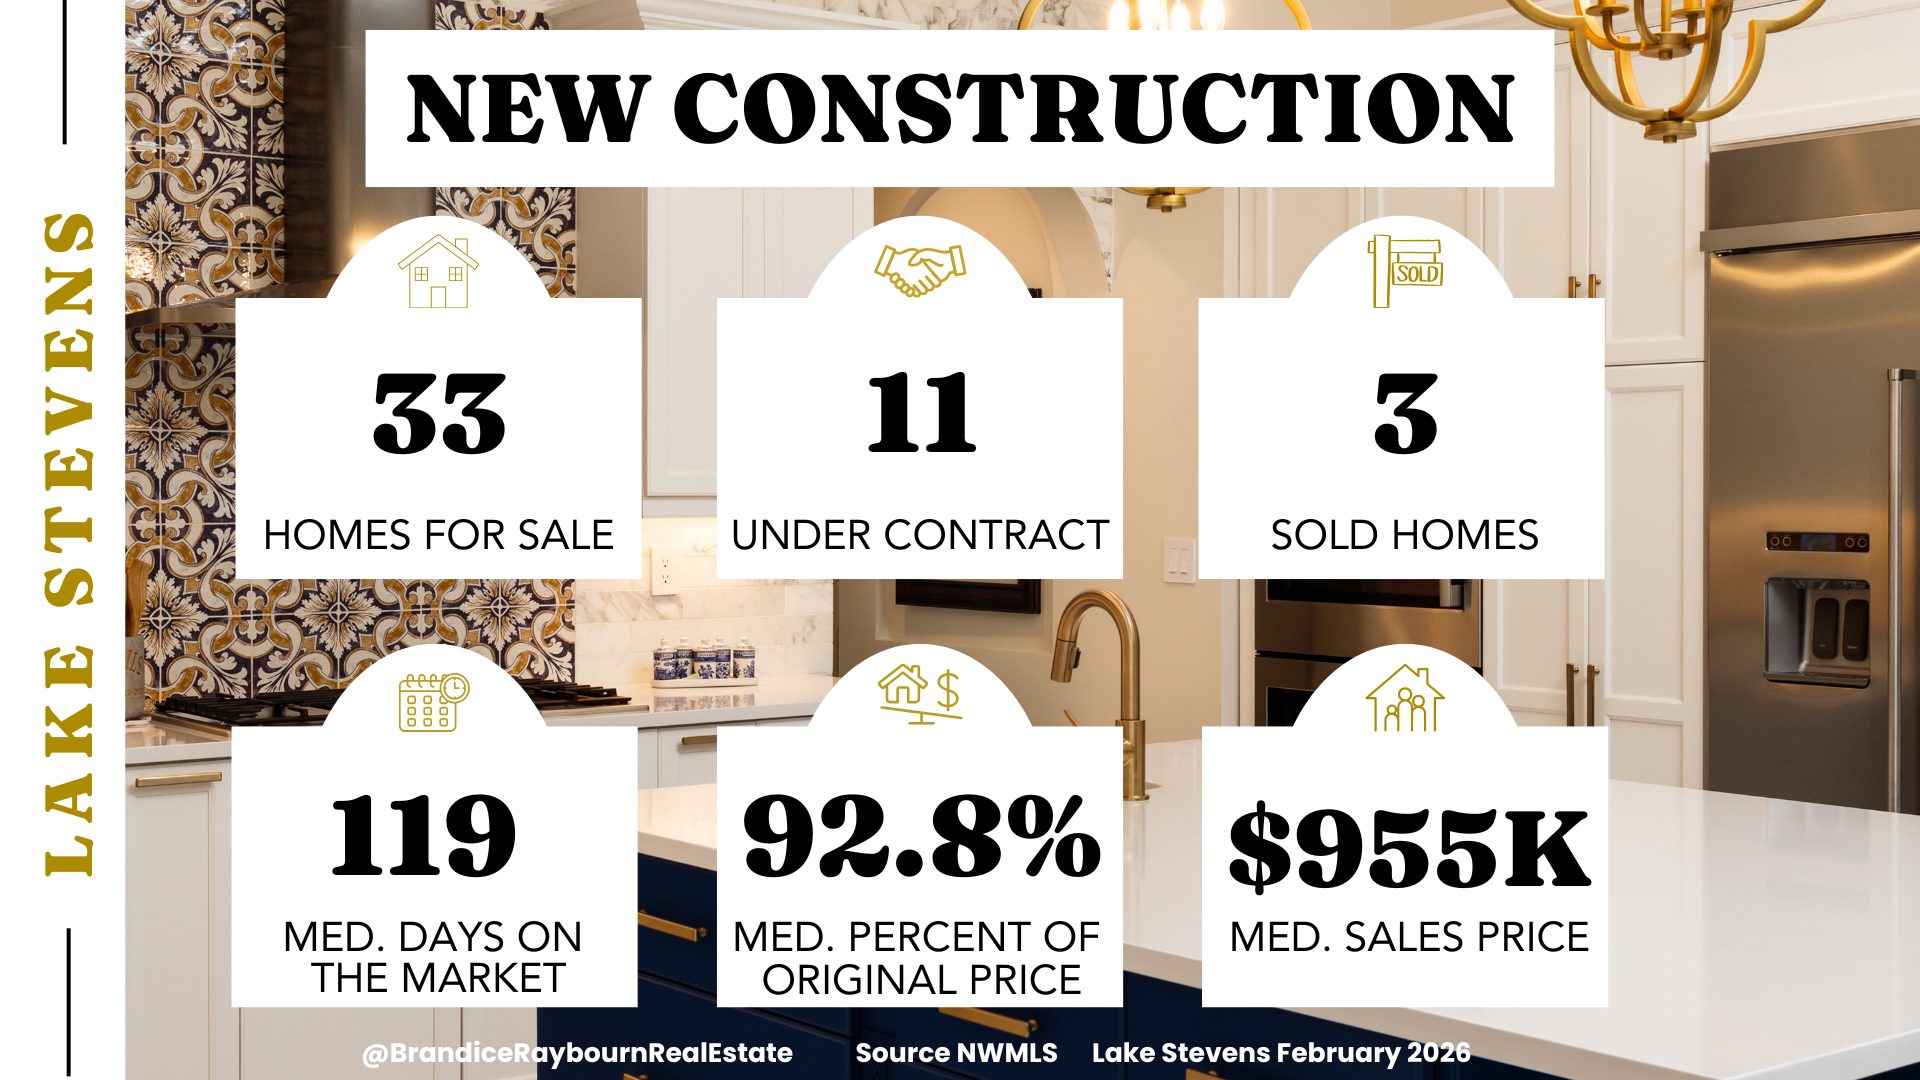
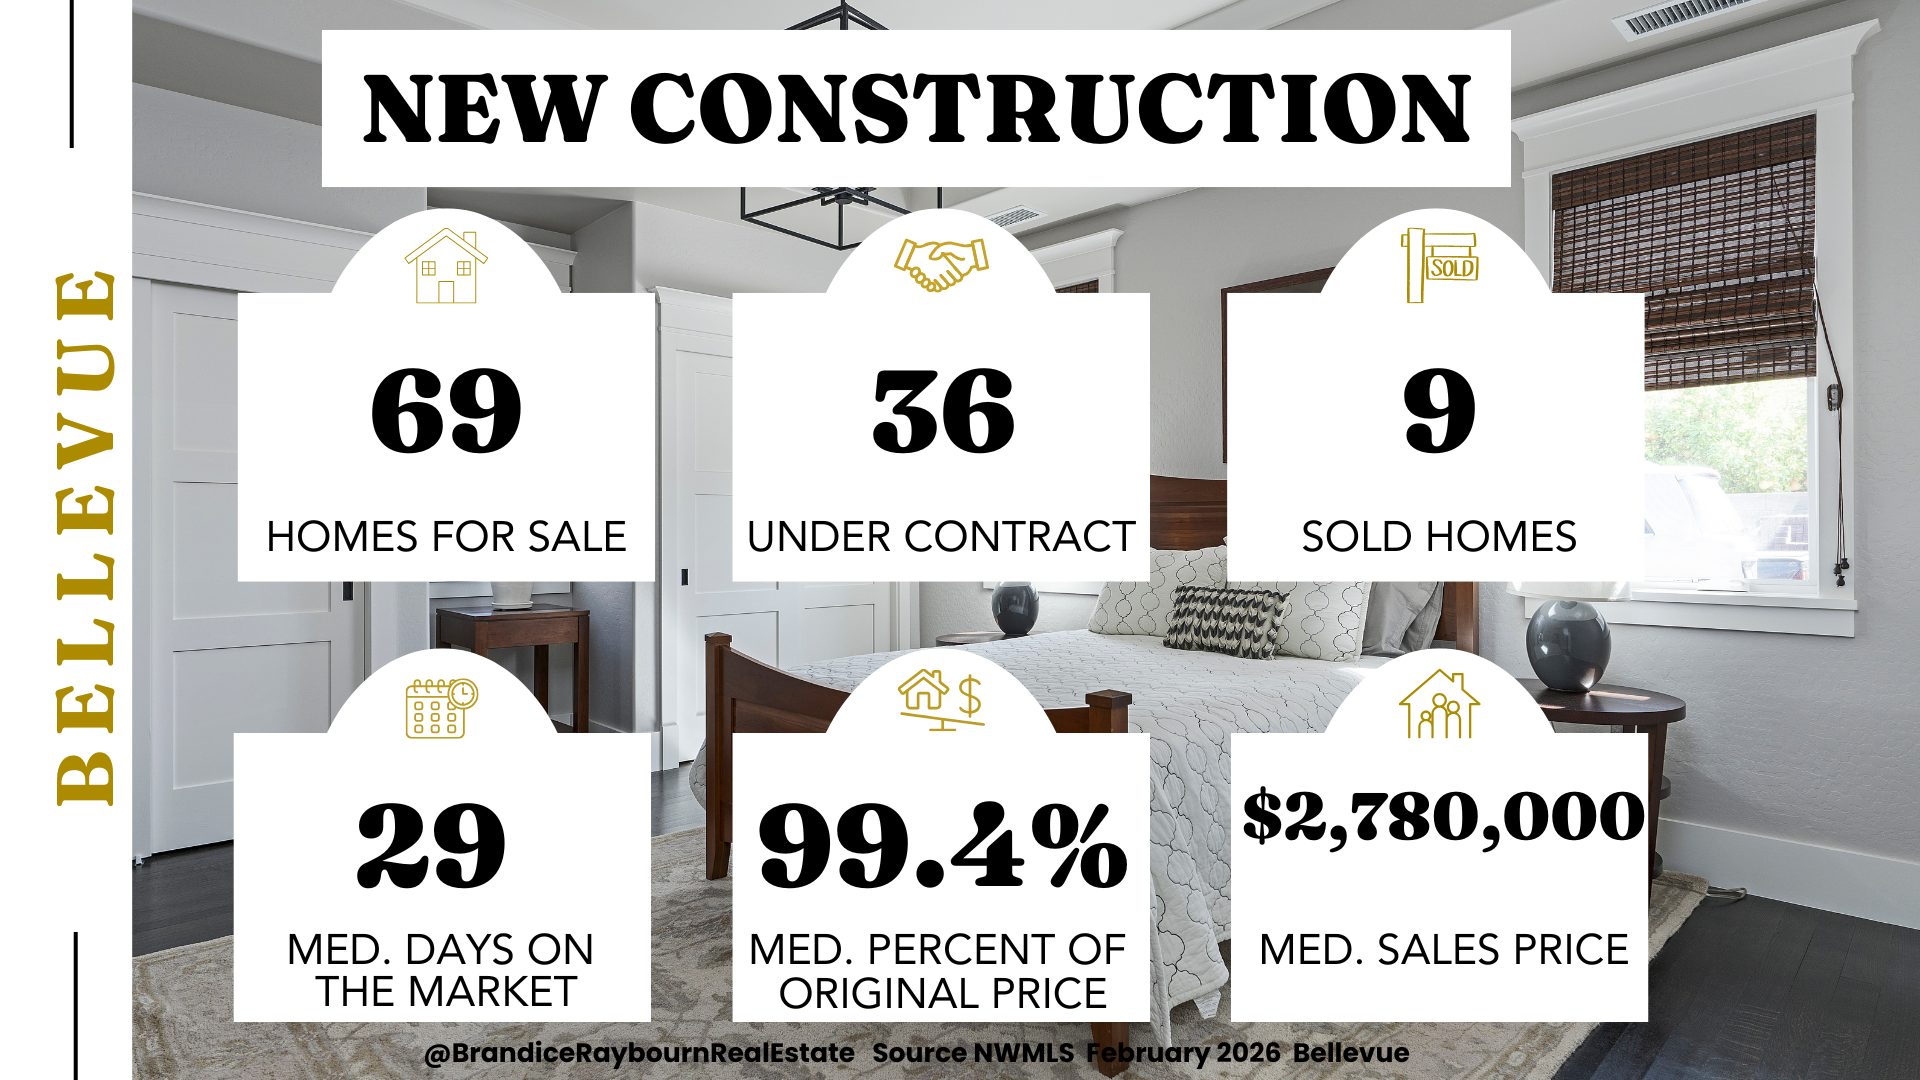
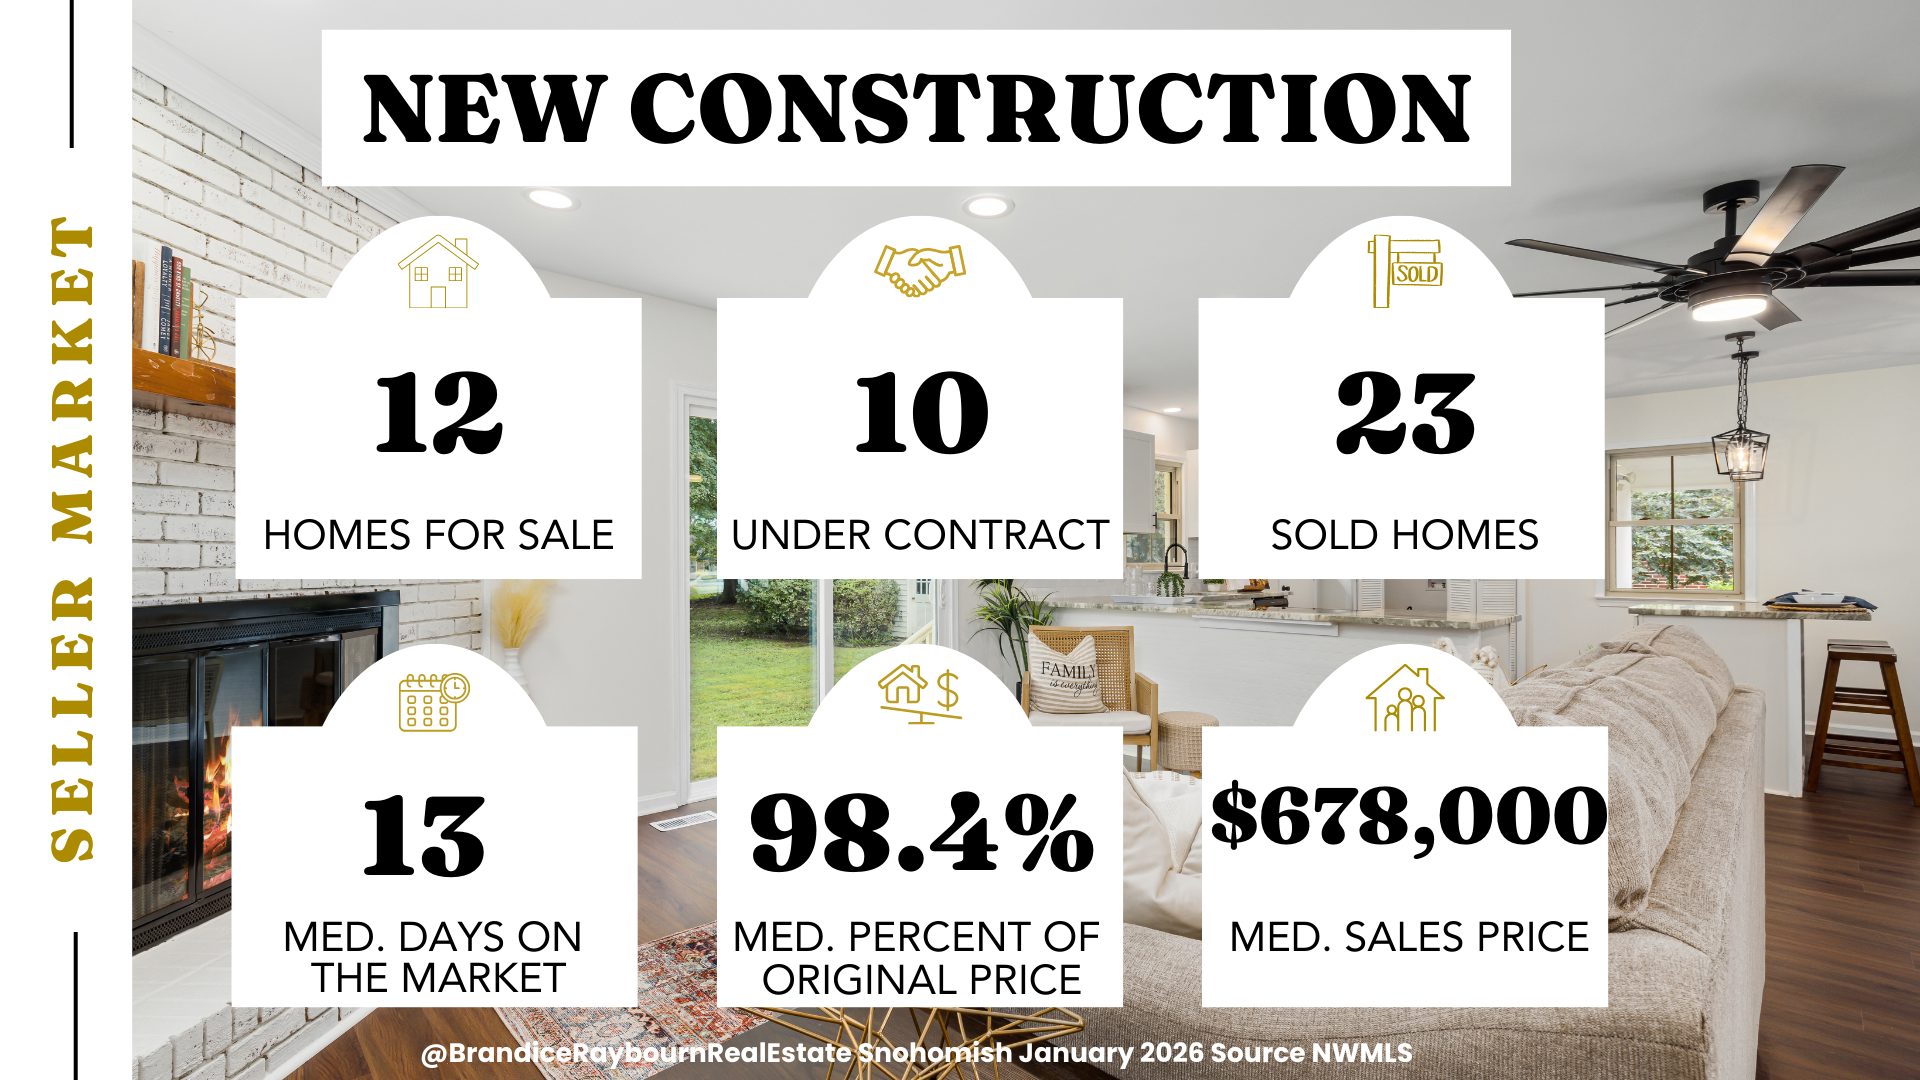
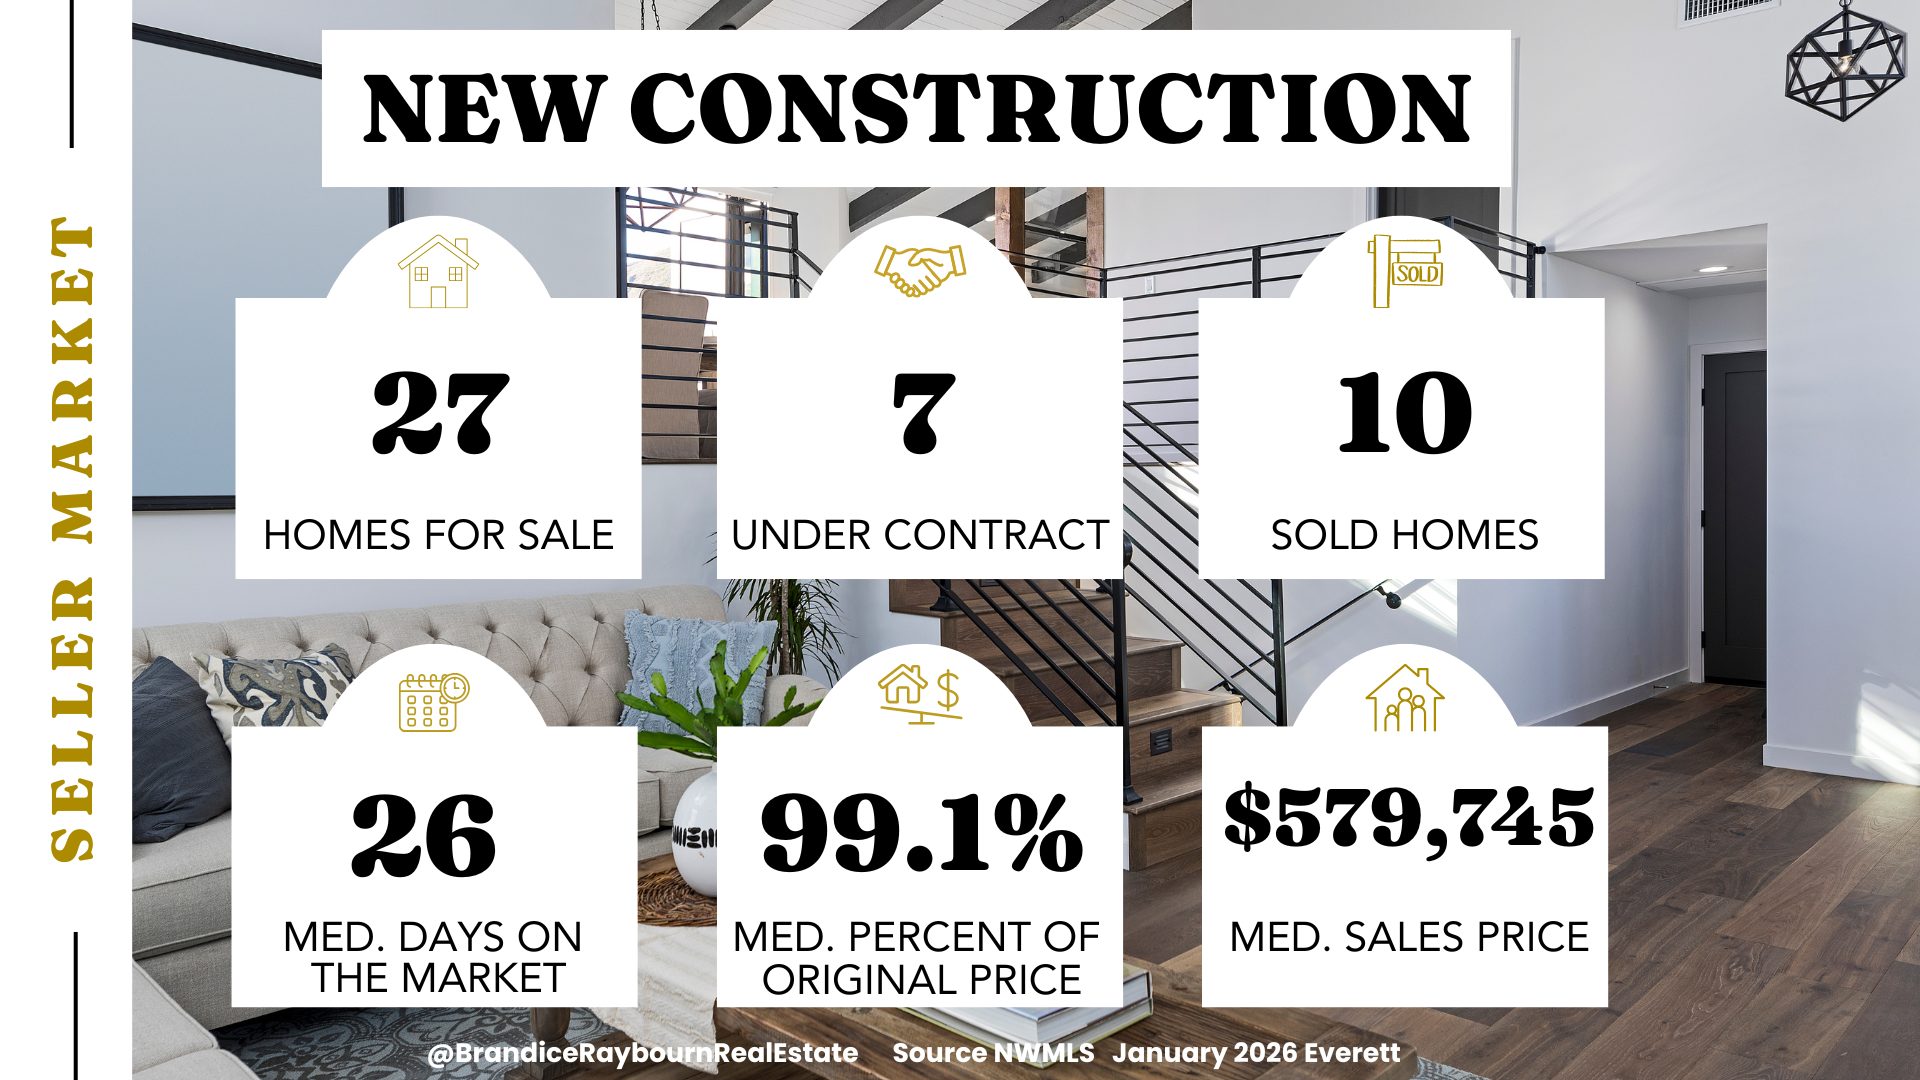
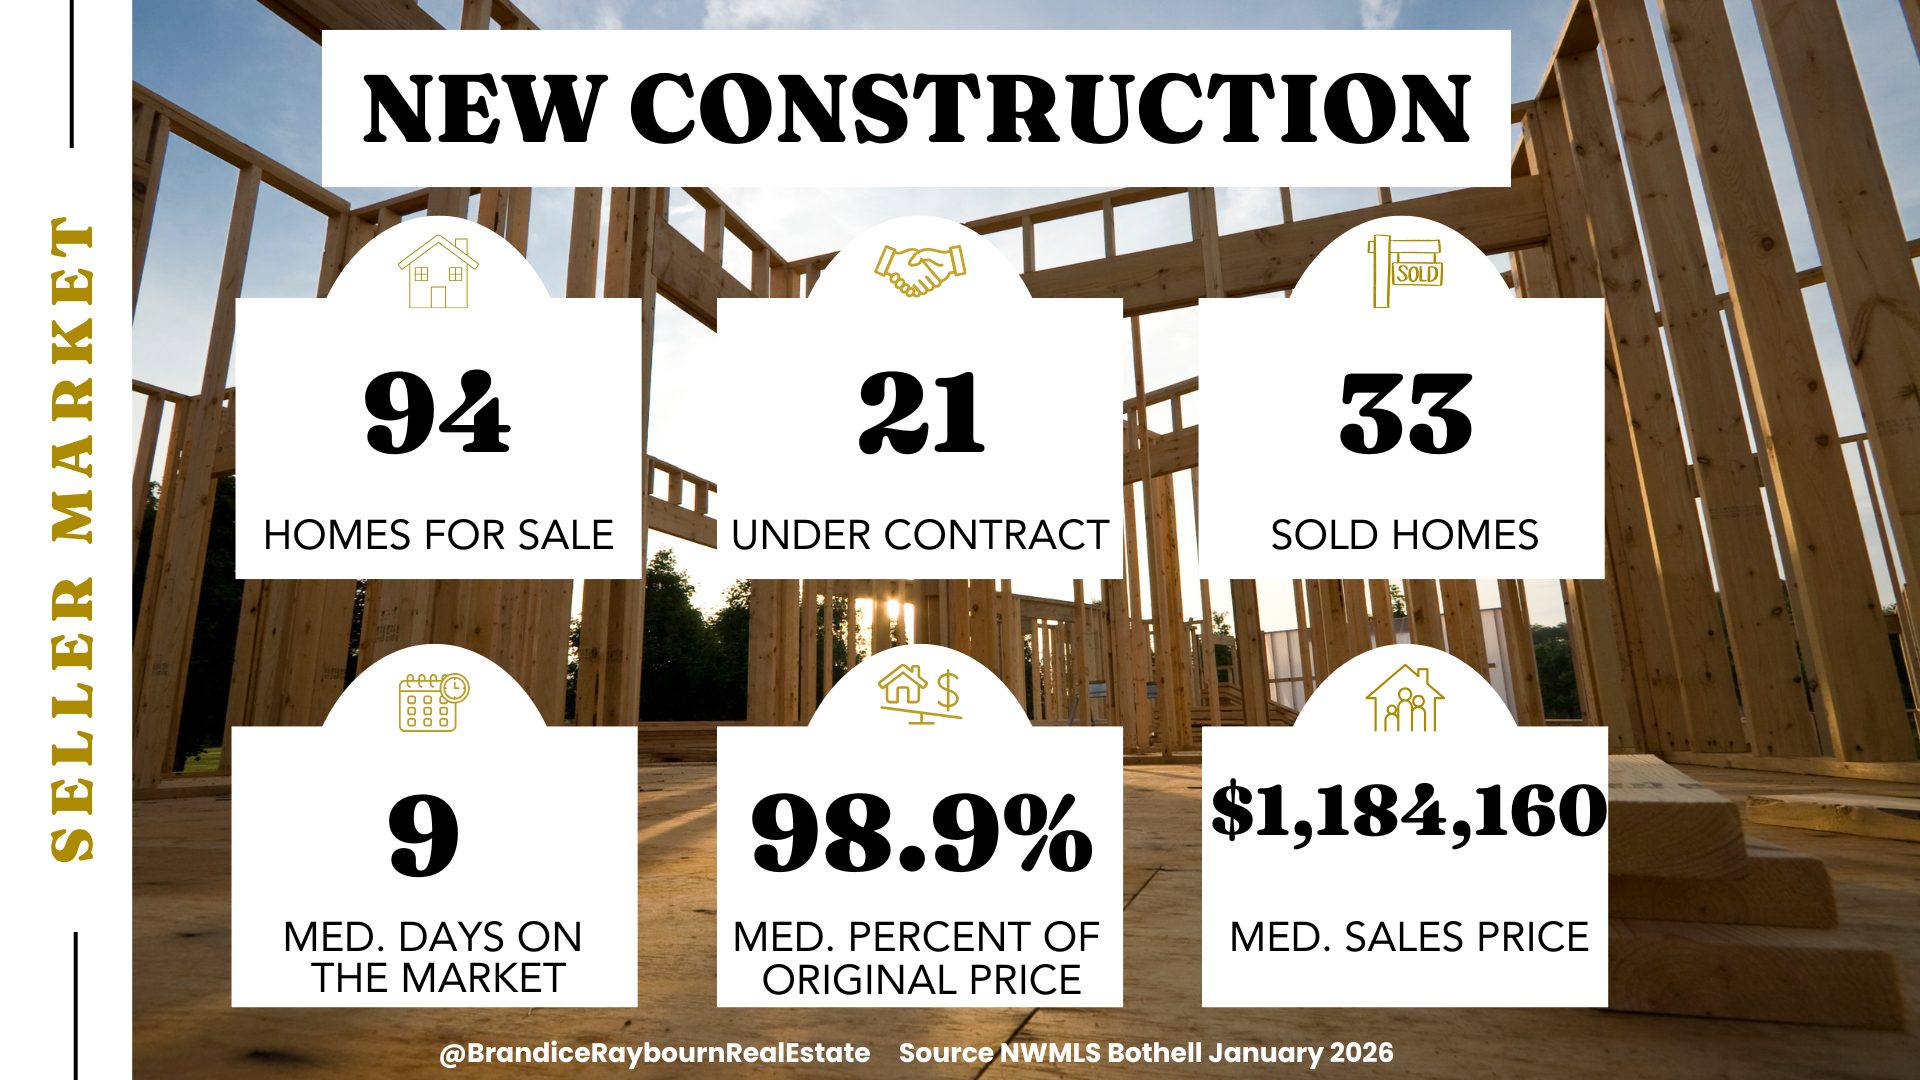
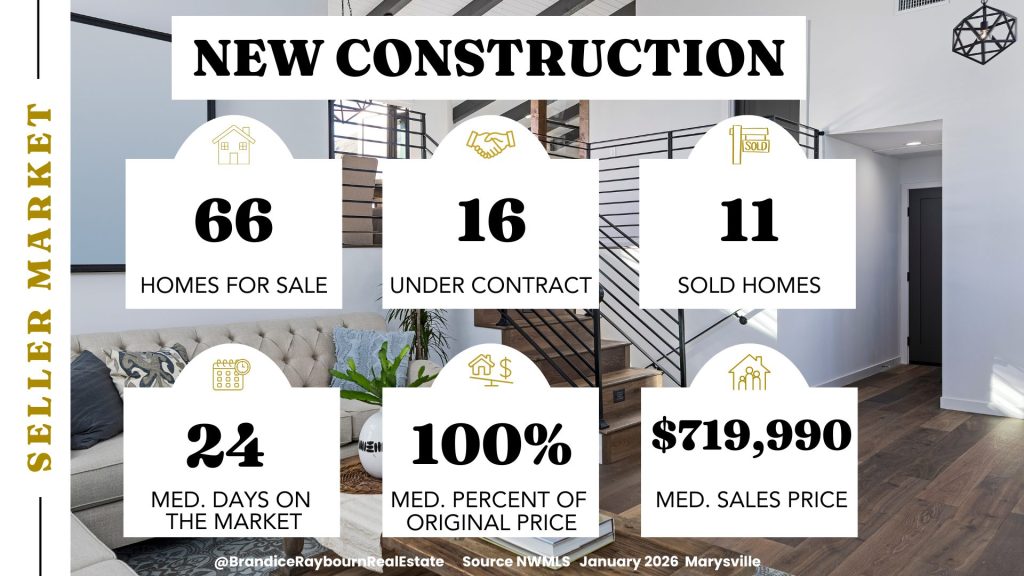
New Construction Homes
New construction continues to be one of the more stable housing types in Snohomish, and even across Snohomish and King counties, though the slowdown is noticeable here as well. Buyers remain attracted to newer homes with modern layouts and lower short-term maintenance, but decisions are taking longer.
Homes that are priced realistically and positioned well are still moving. Builders who are pushing pricing or offering fewer incentives than their competitors are seeing longer timelines.
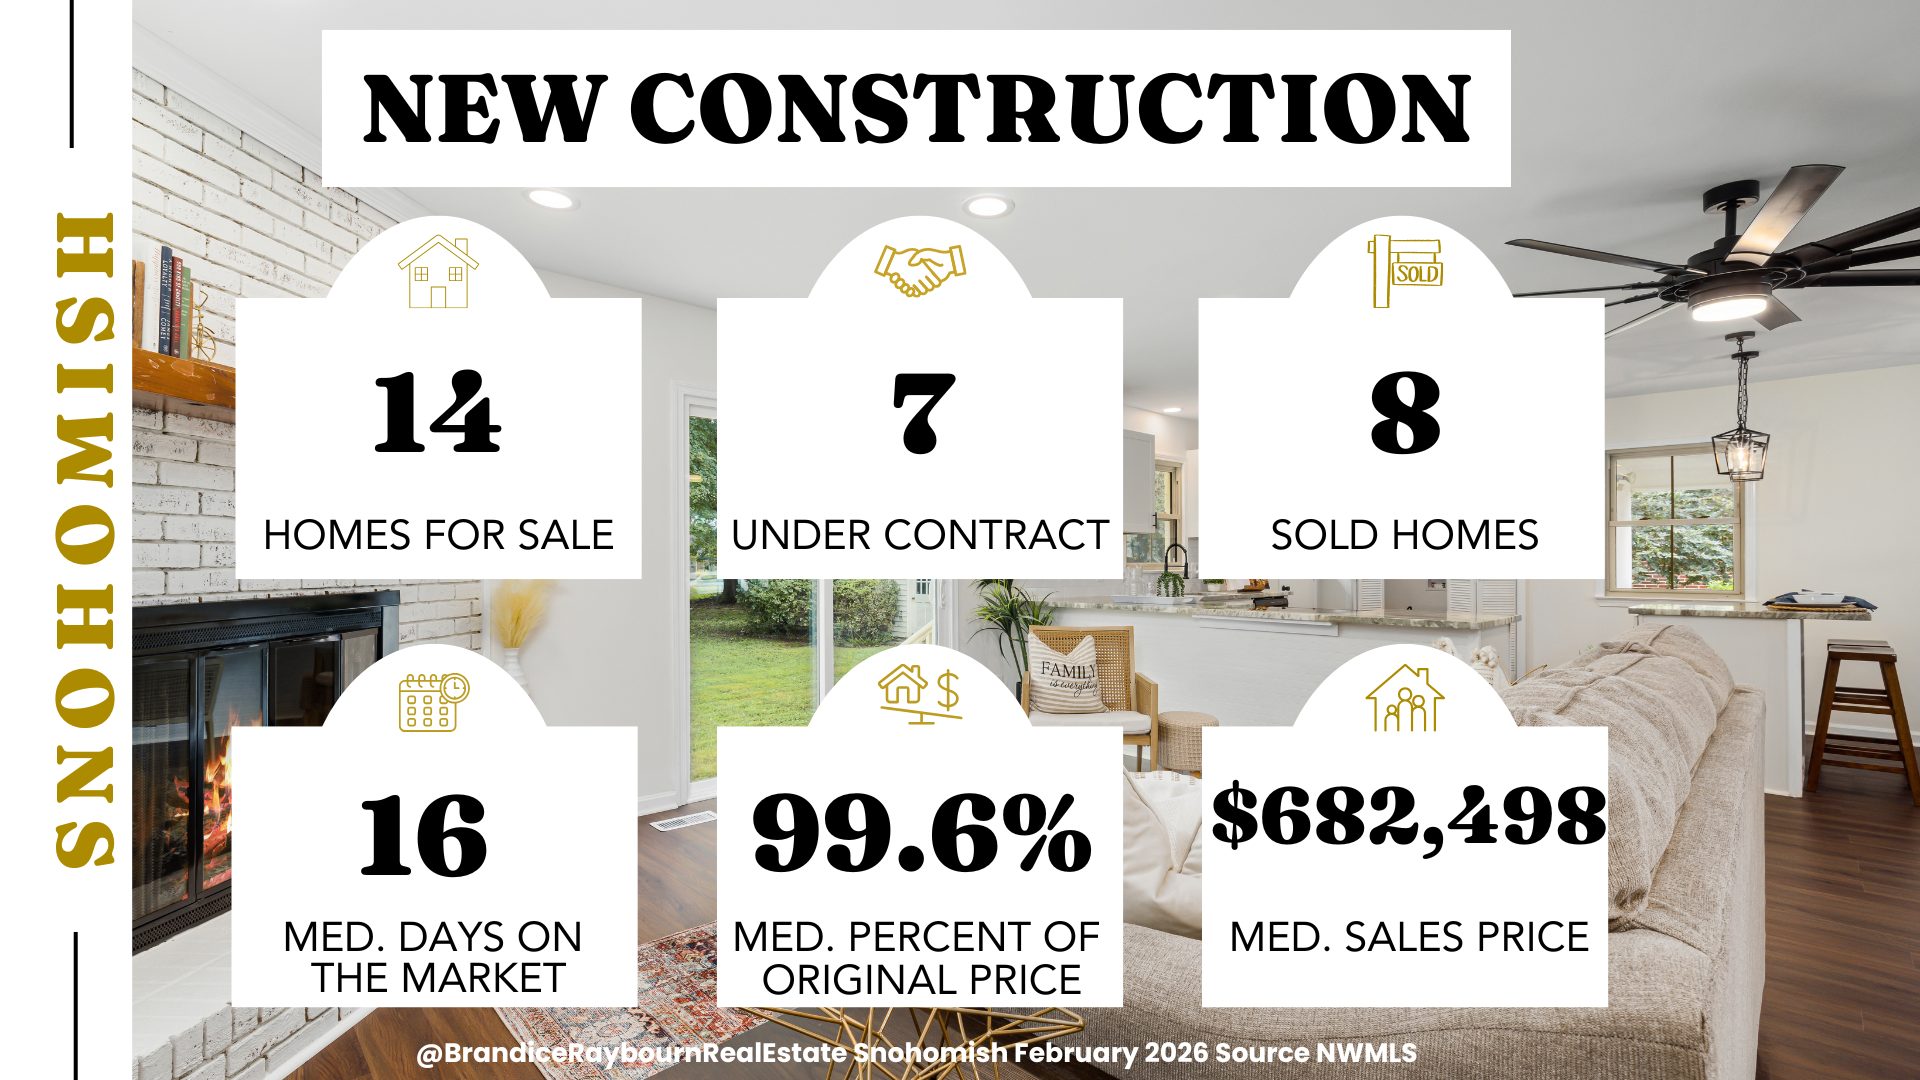
Source: NWMLS | Analysis by Brandice Raybourn
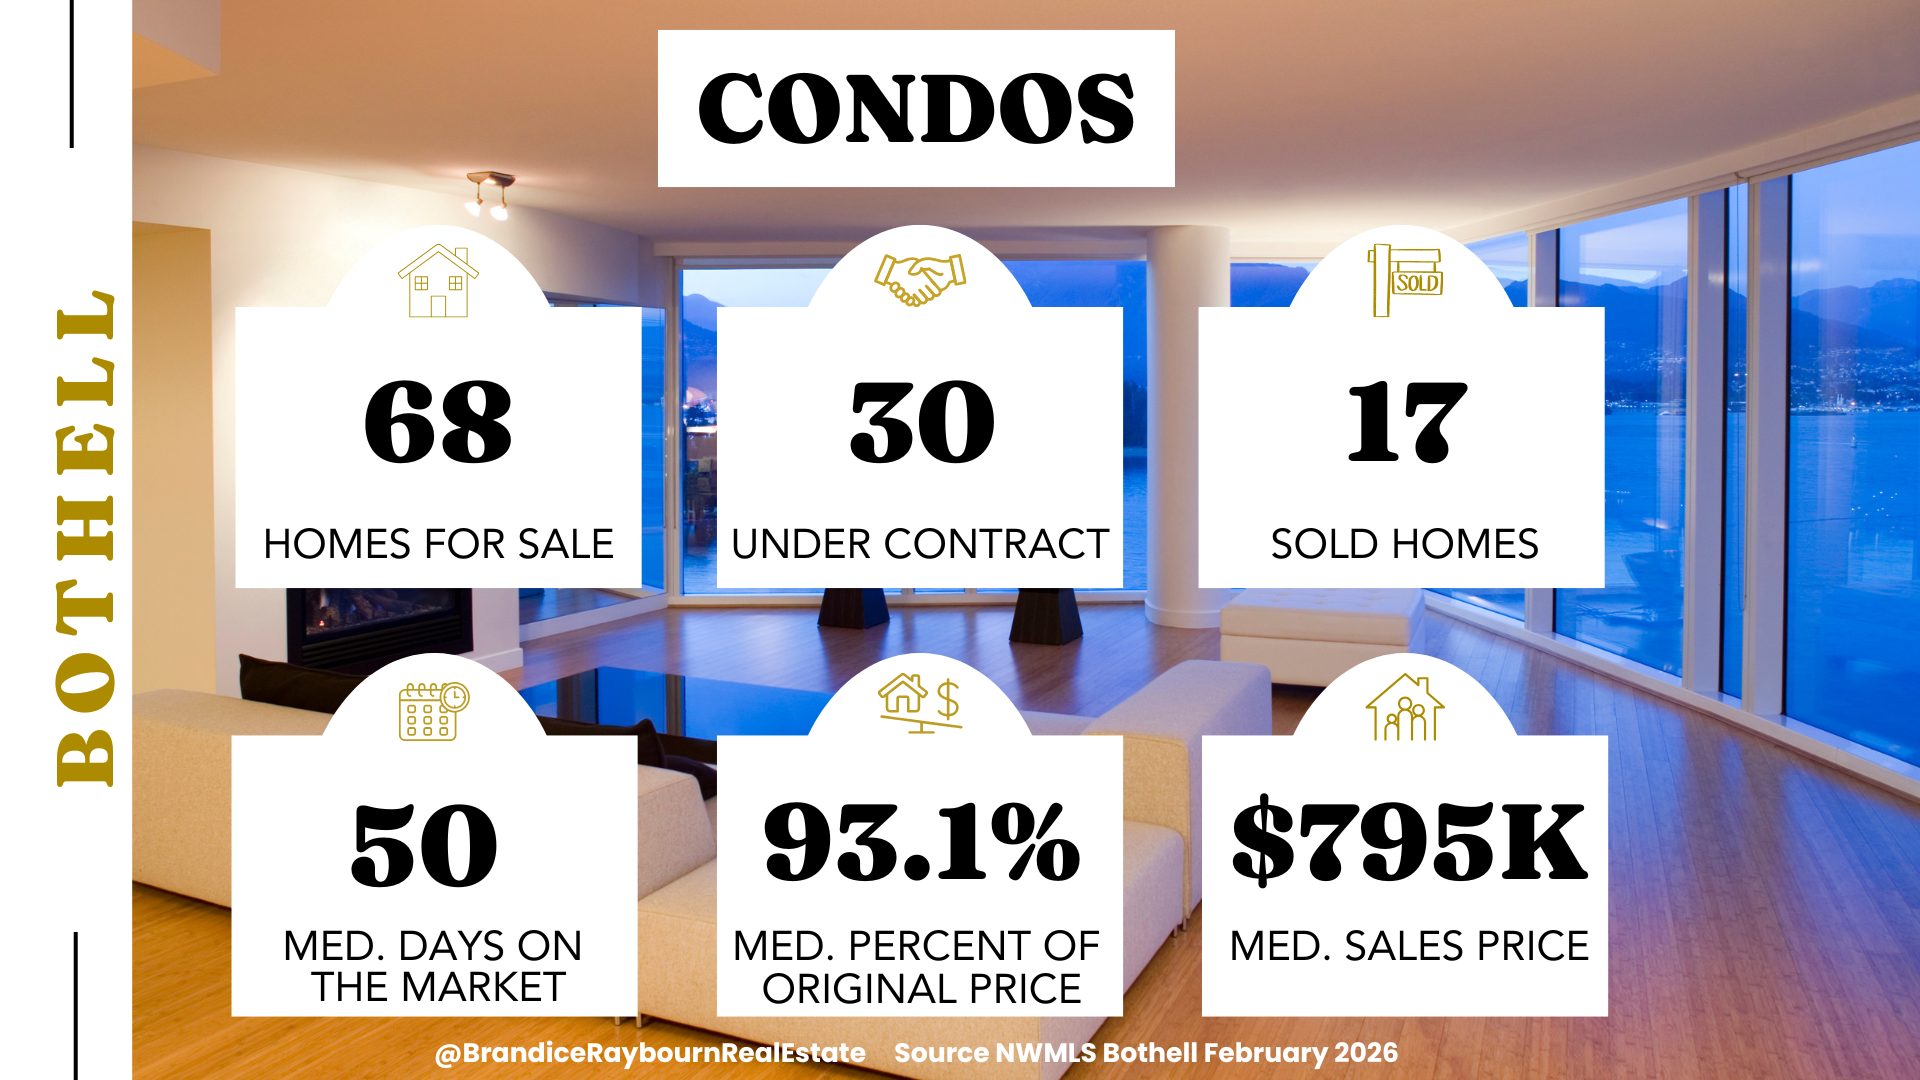
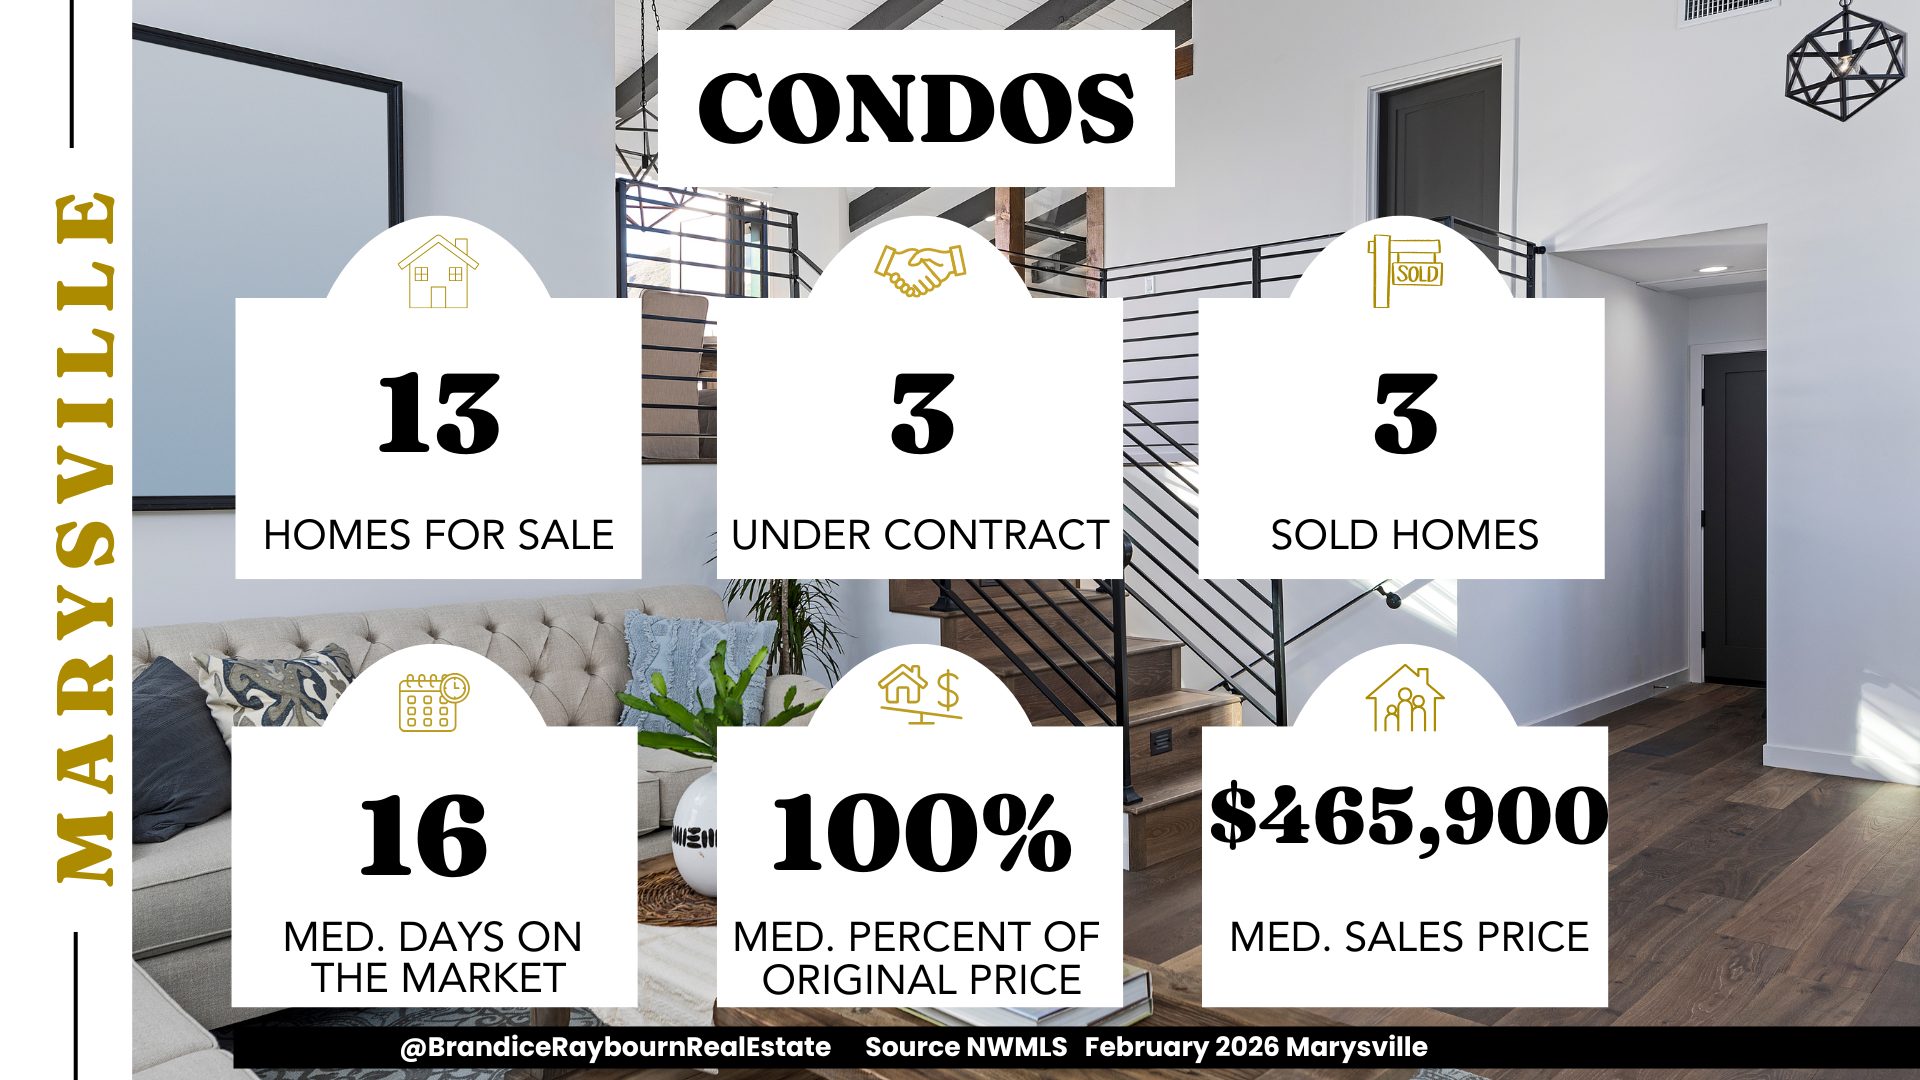
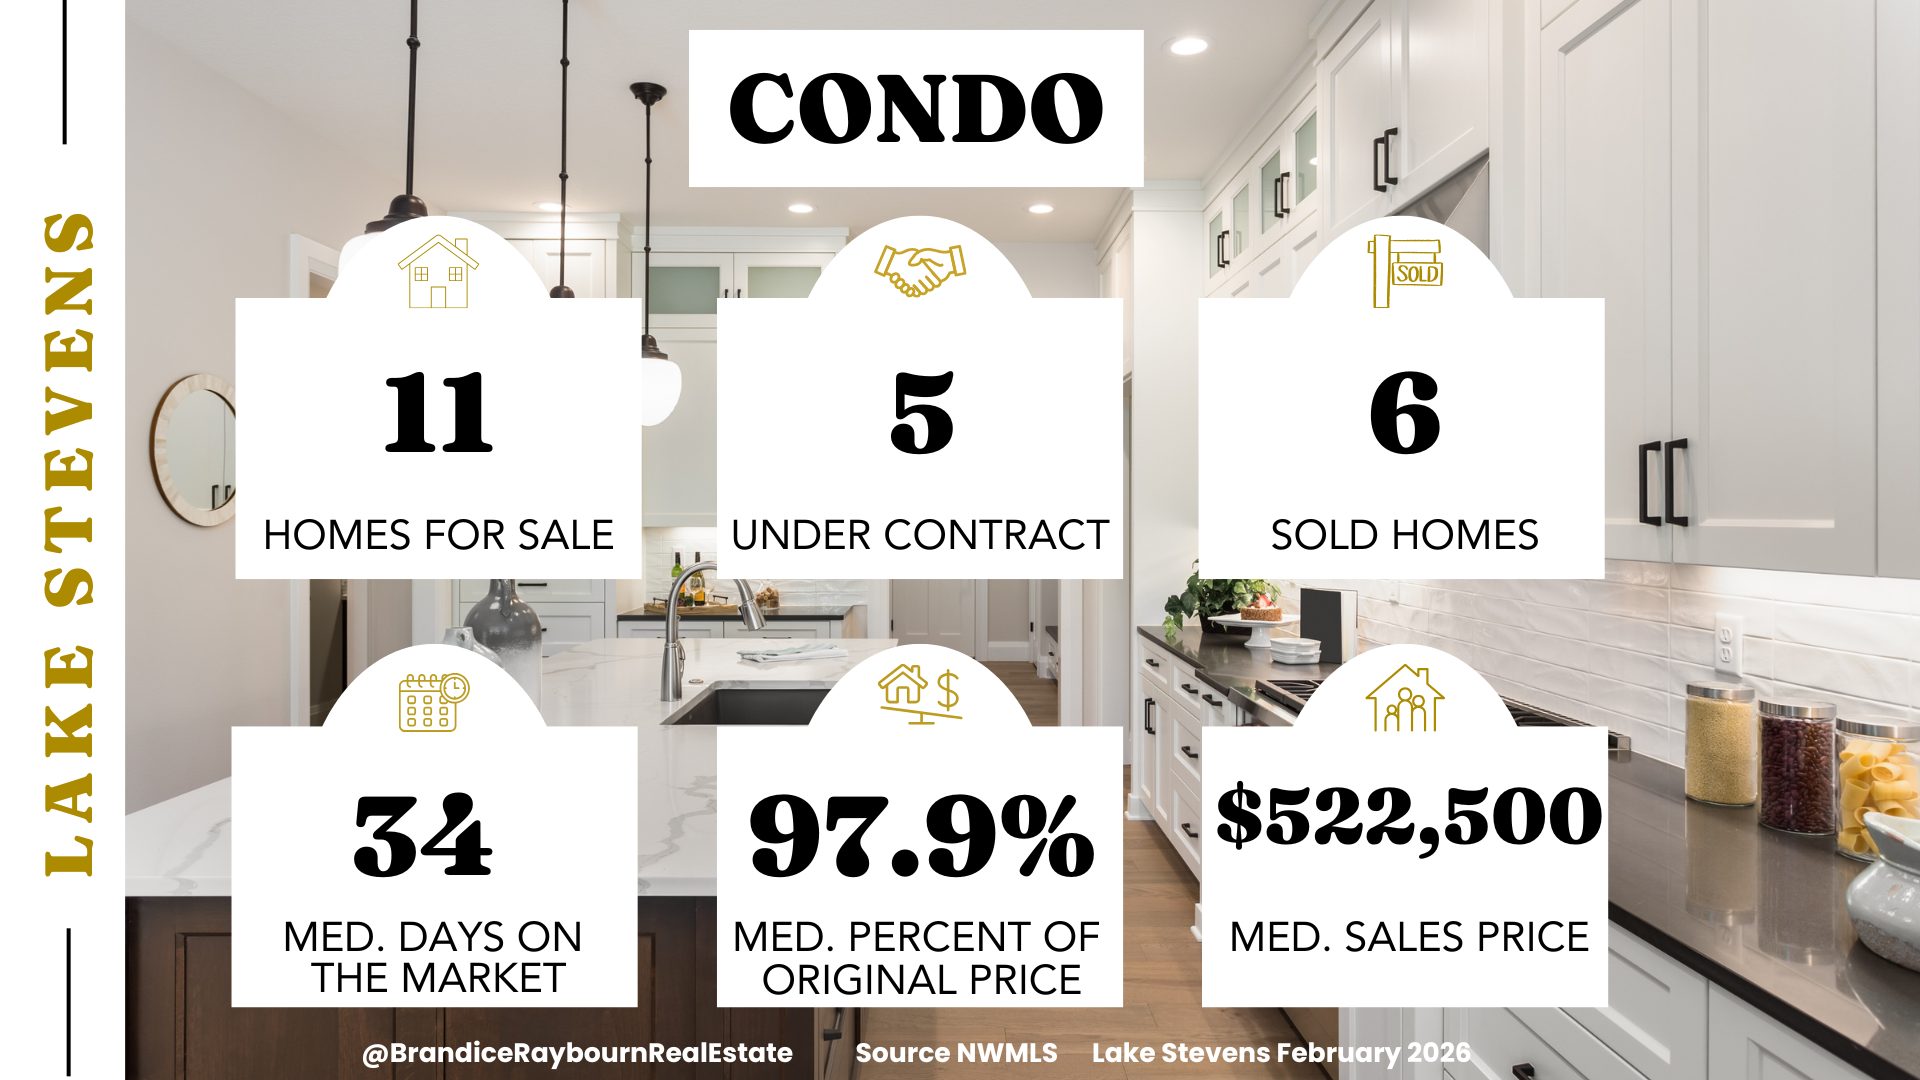
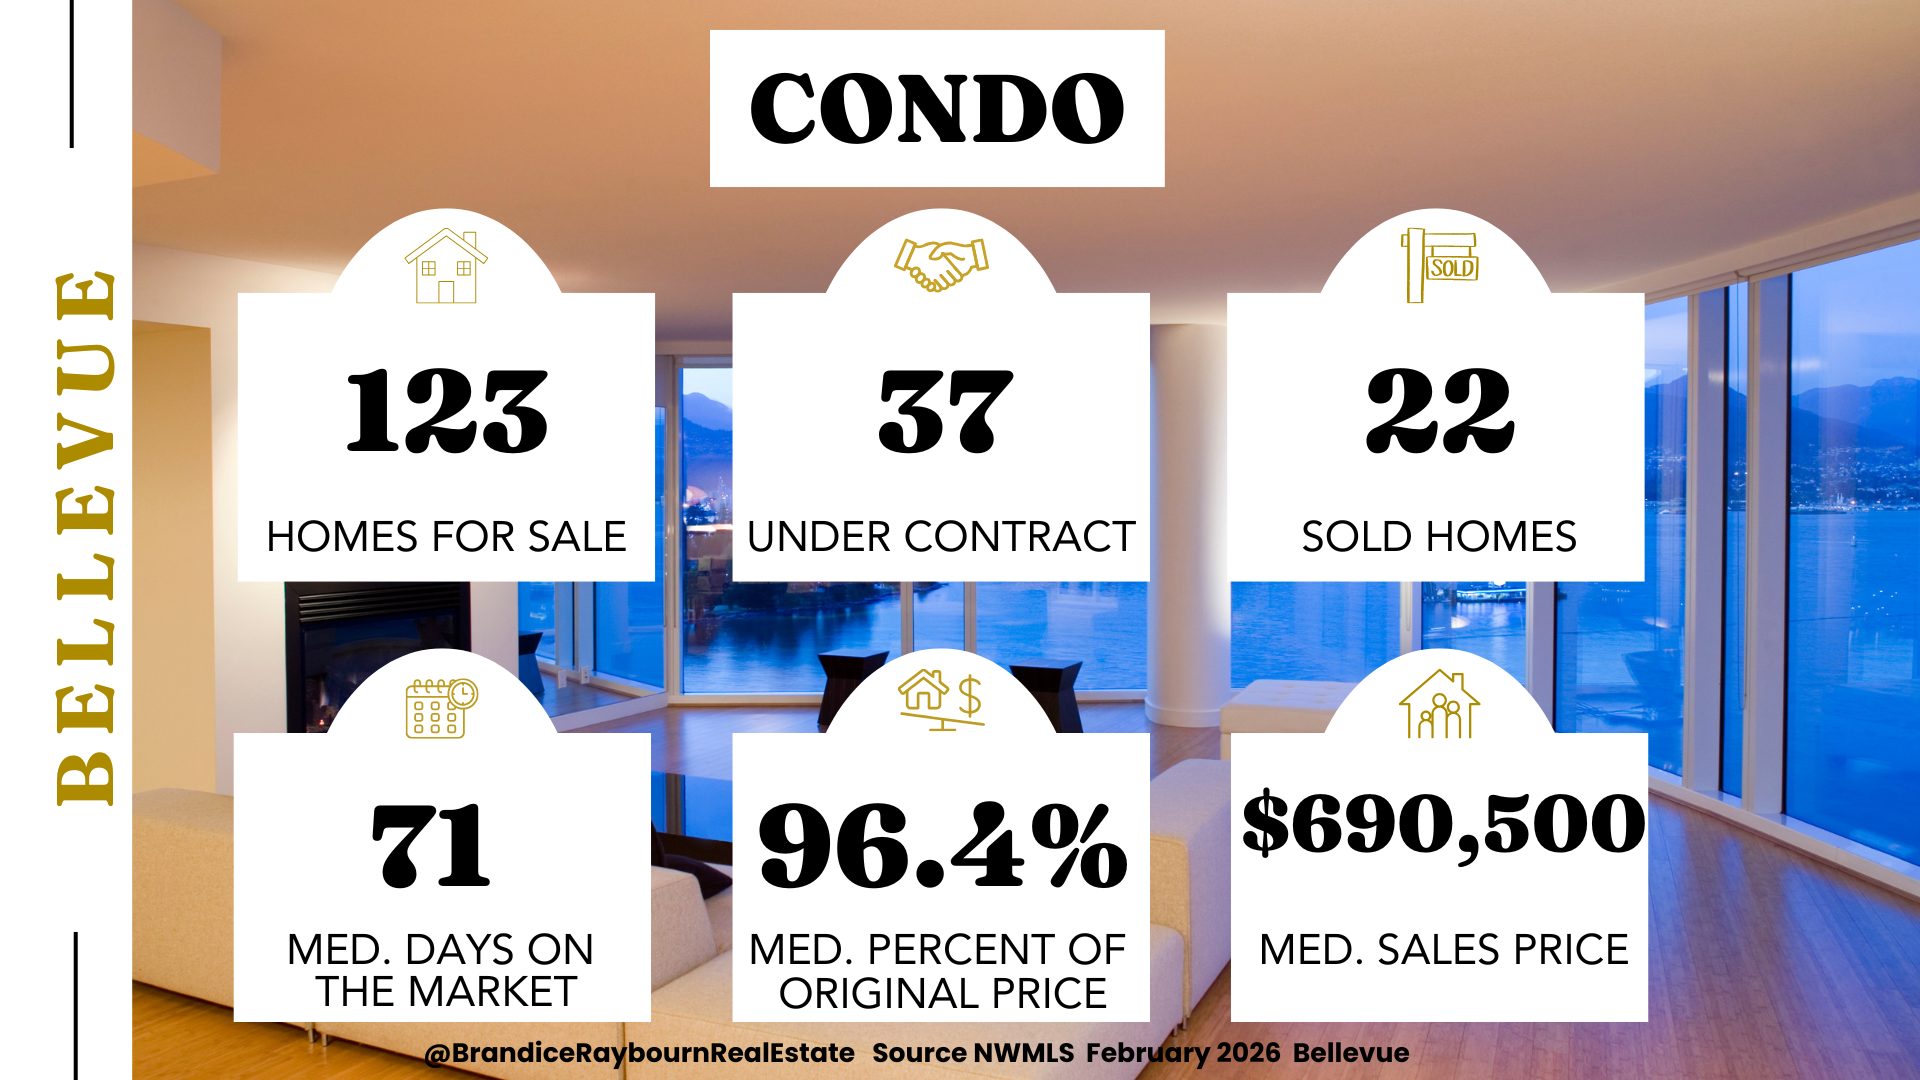
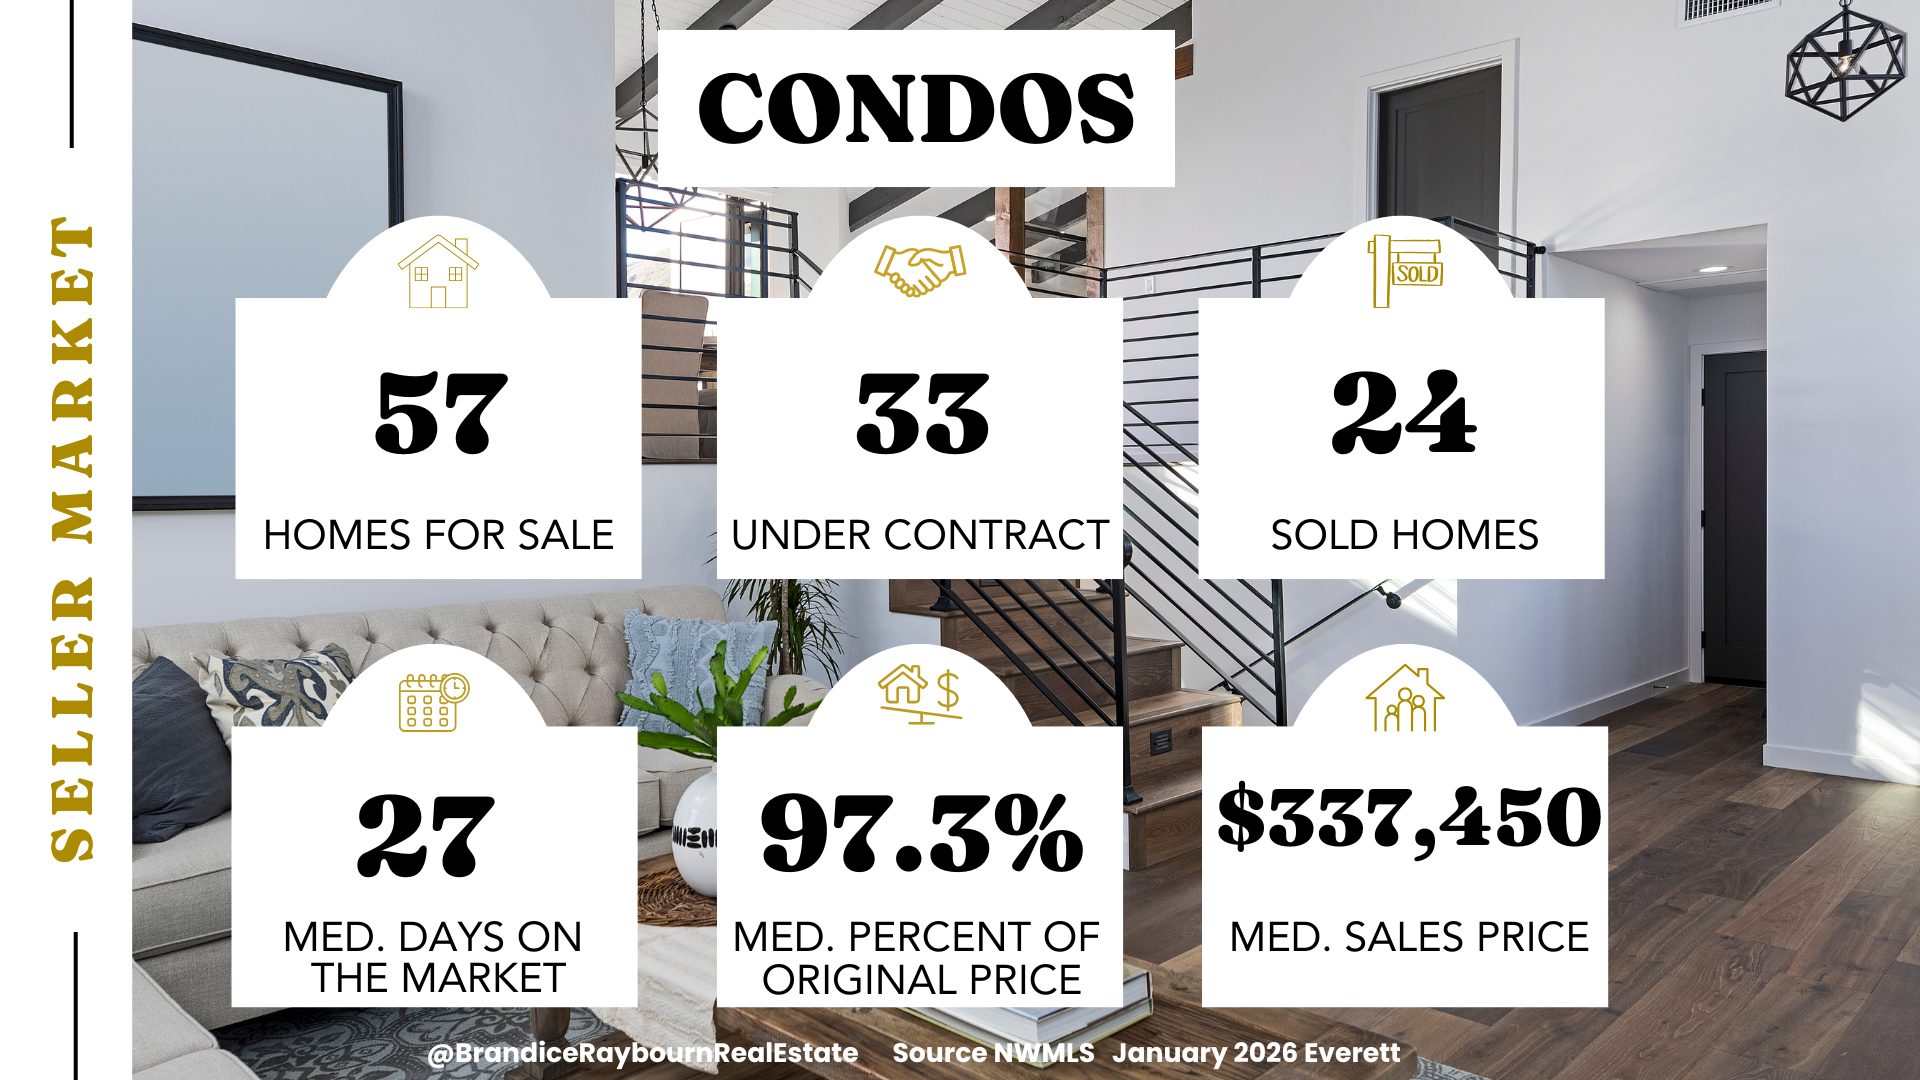
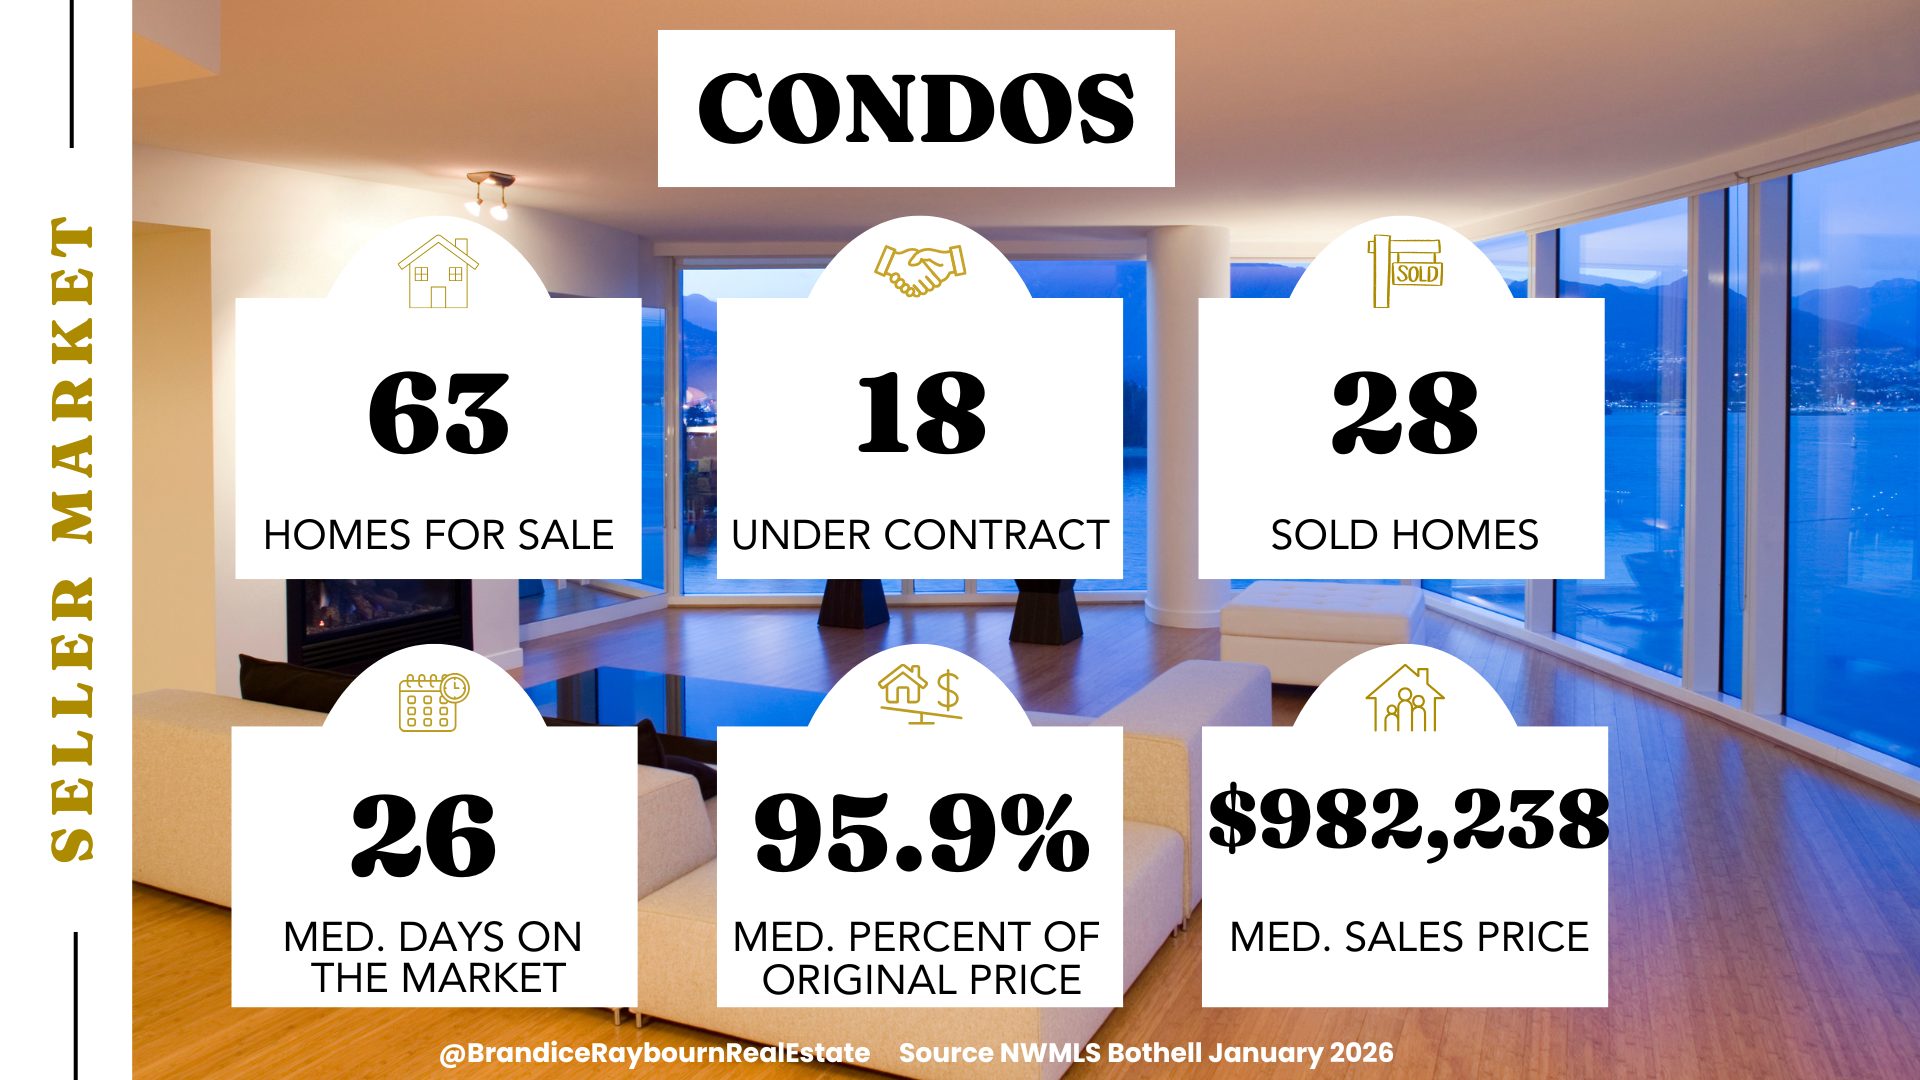
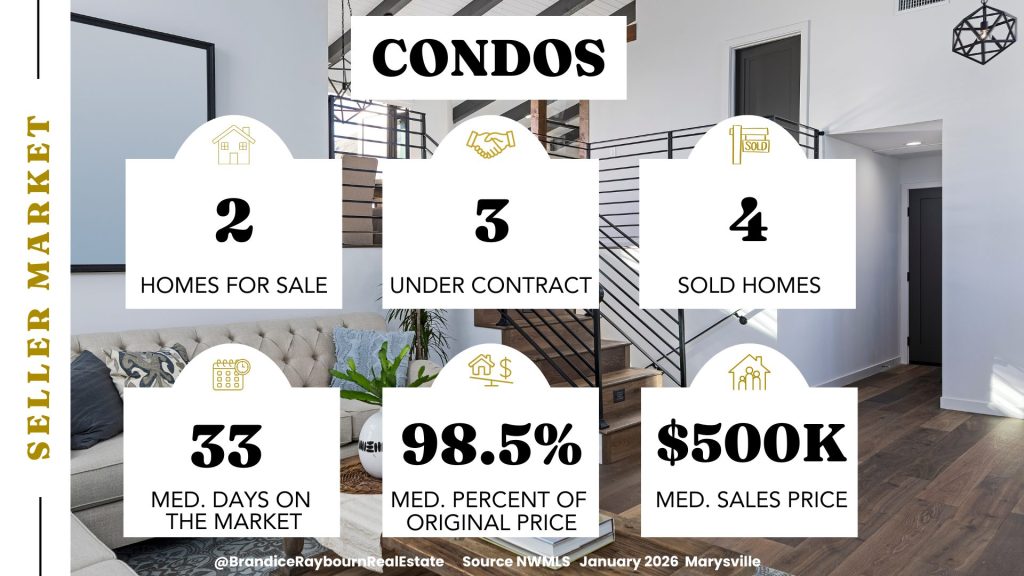
Condos
The condo market is cautious. Buyers are weighing value carefully and are no longer rushing decisions, which is a consistent theme this month. Longer days on market reflect a negotiation-friendly environment where buyers feel comfortable taking their time.
For sellers, pricing, condition, and HOA clarity matter more than ever. Buyers have leverage in this segment.
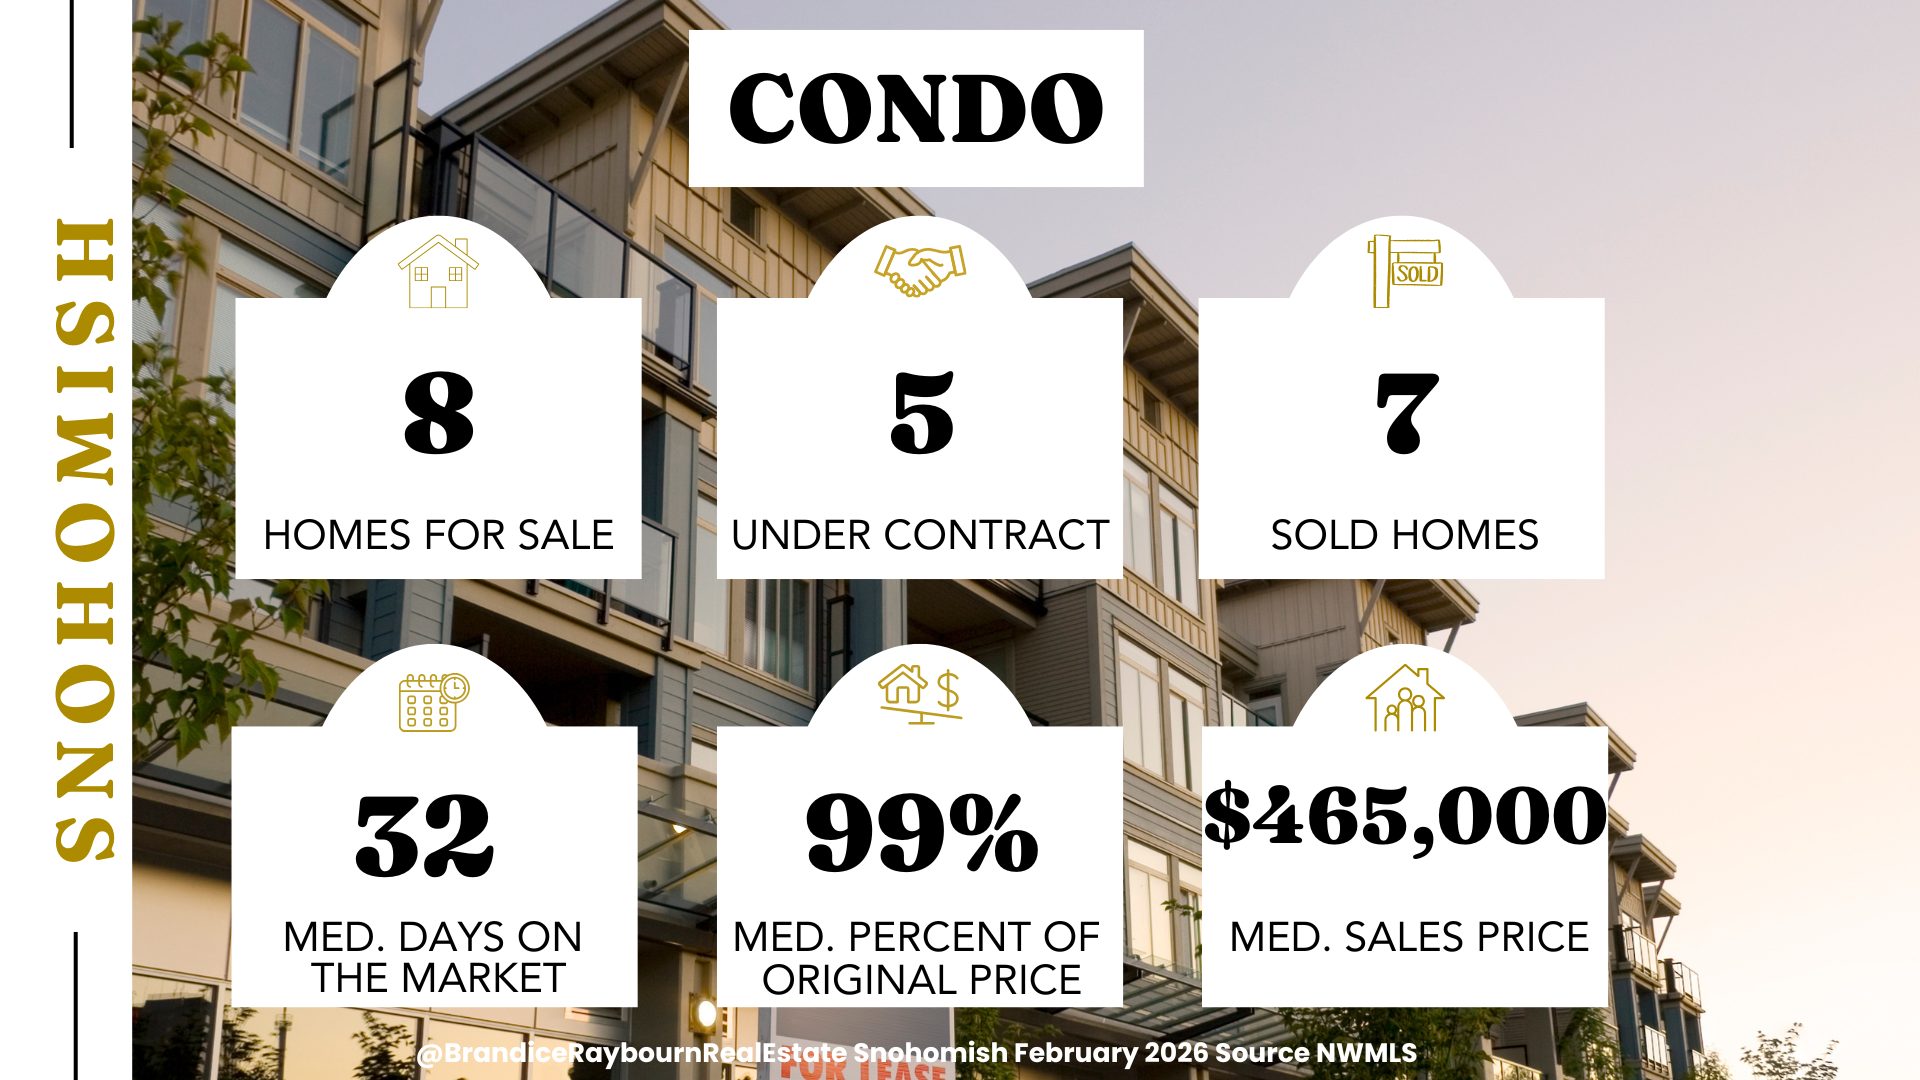
Source: NWMLS | Analysis by Brandice Raybourn
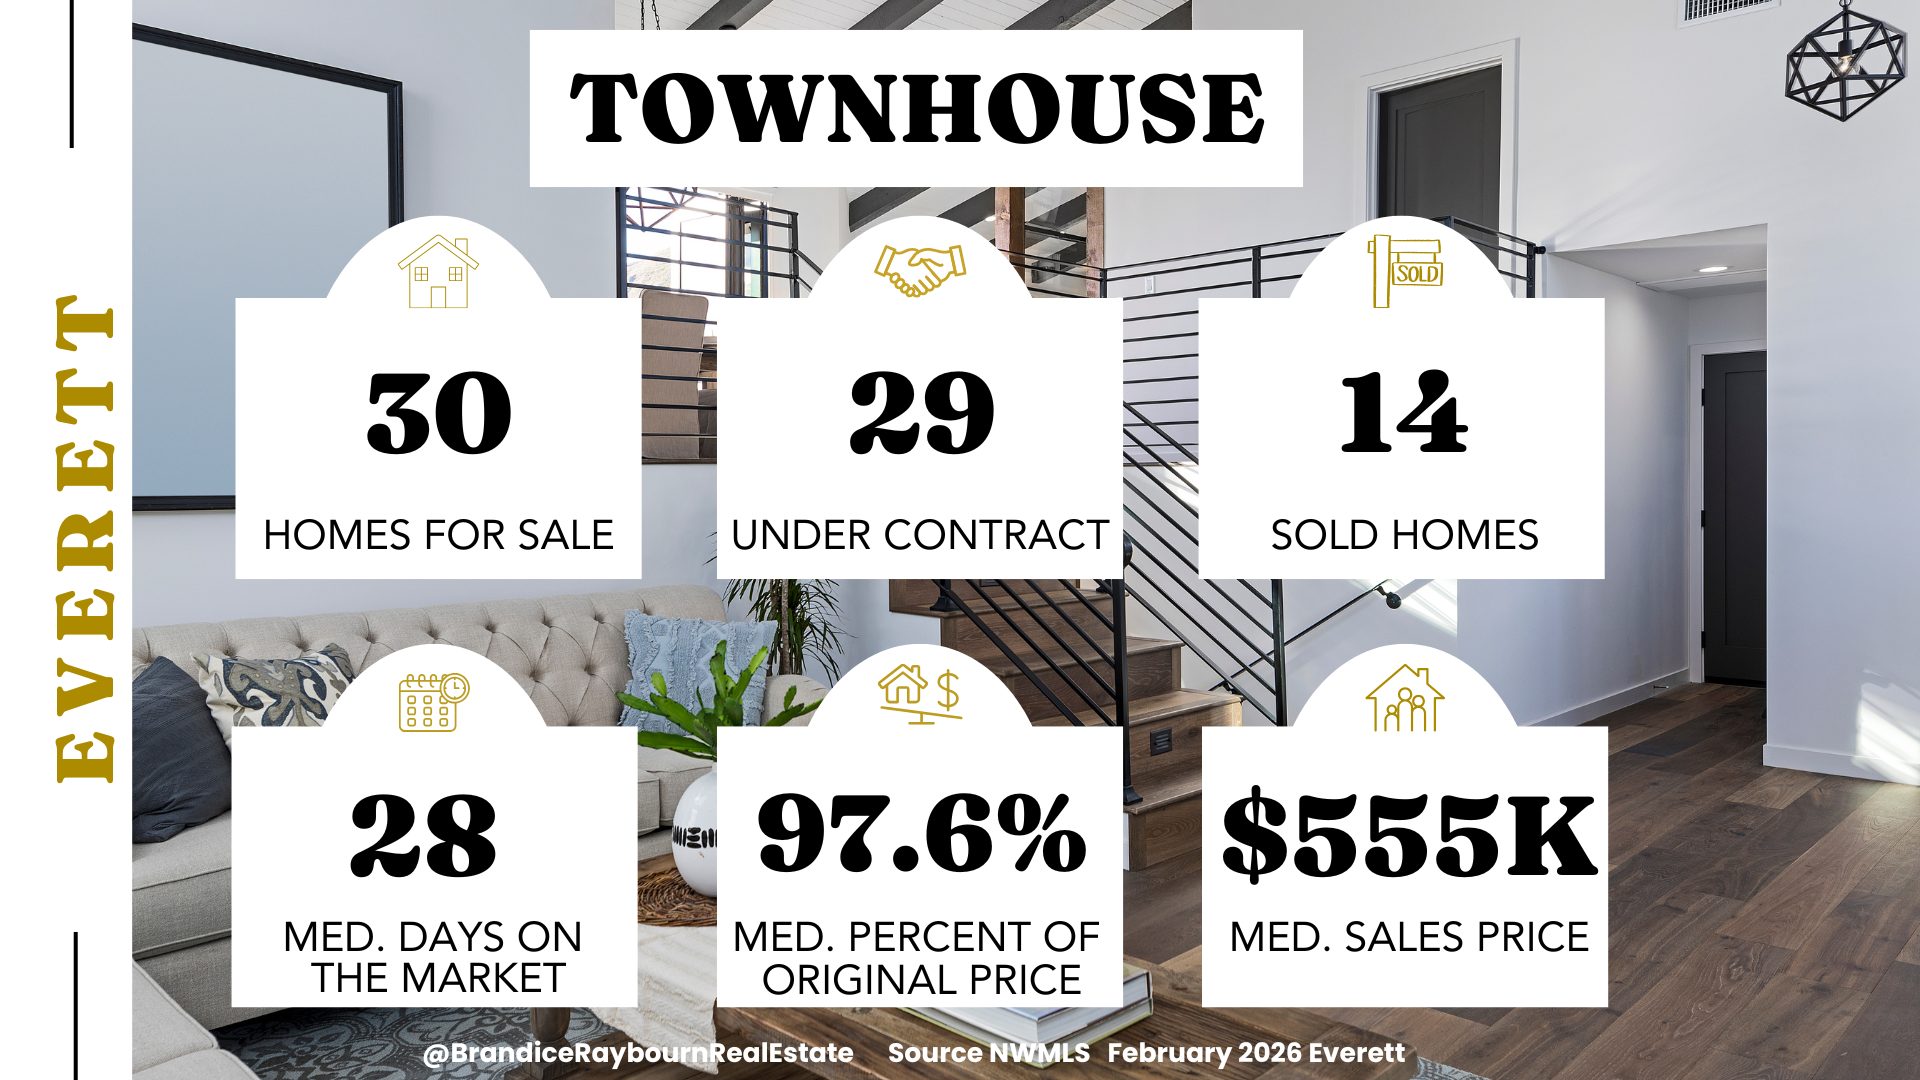
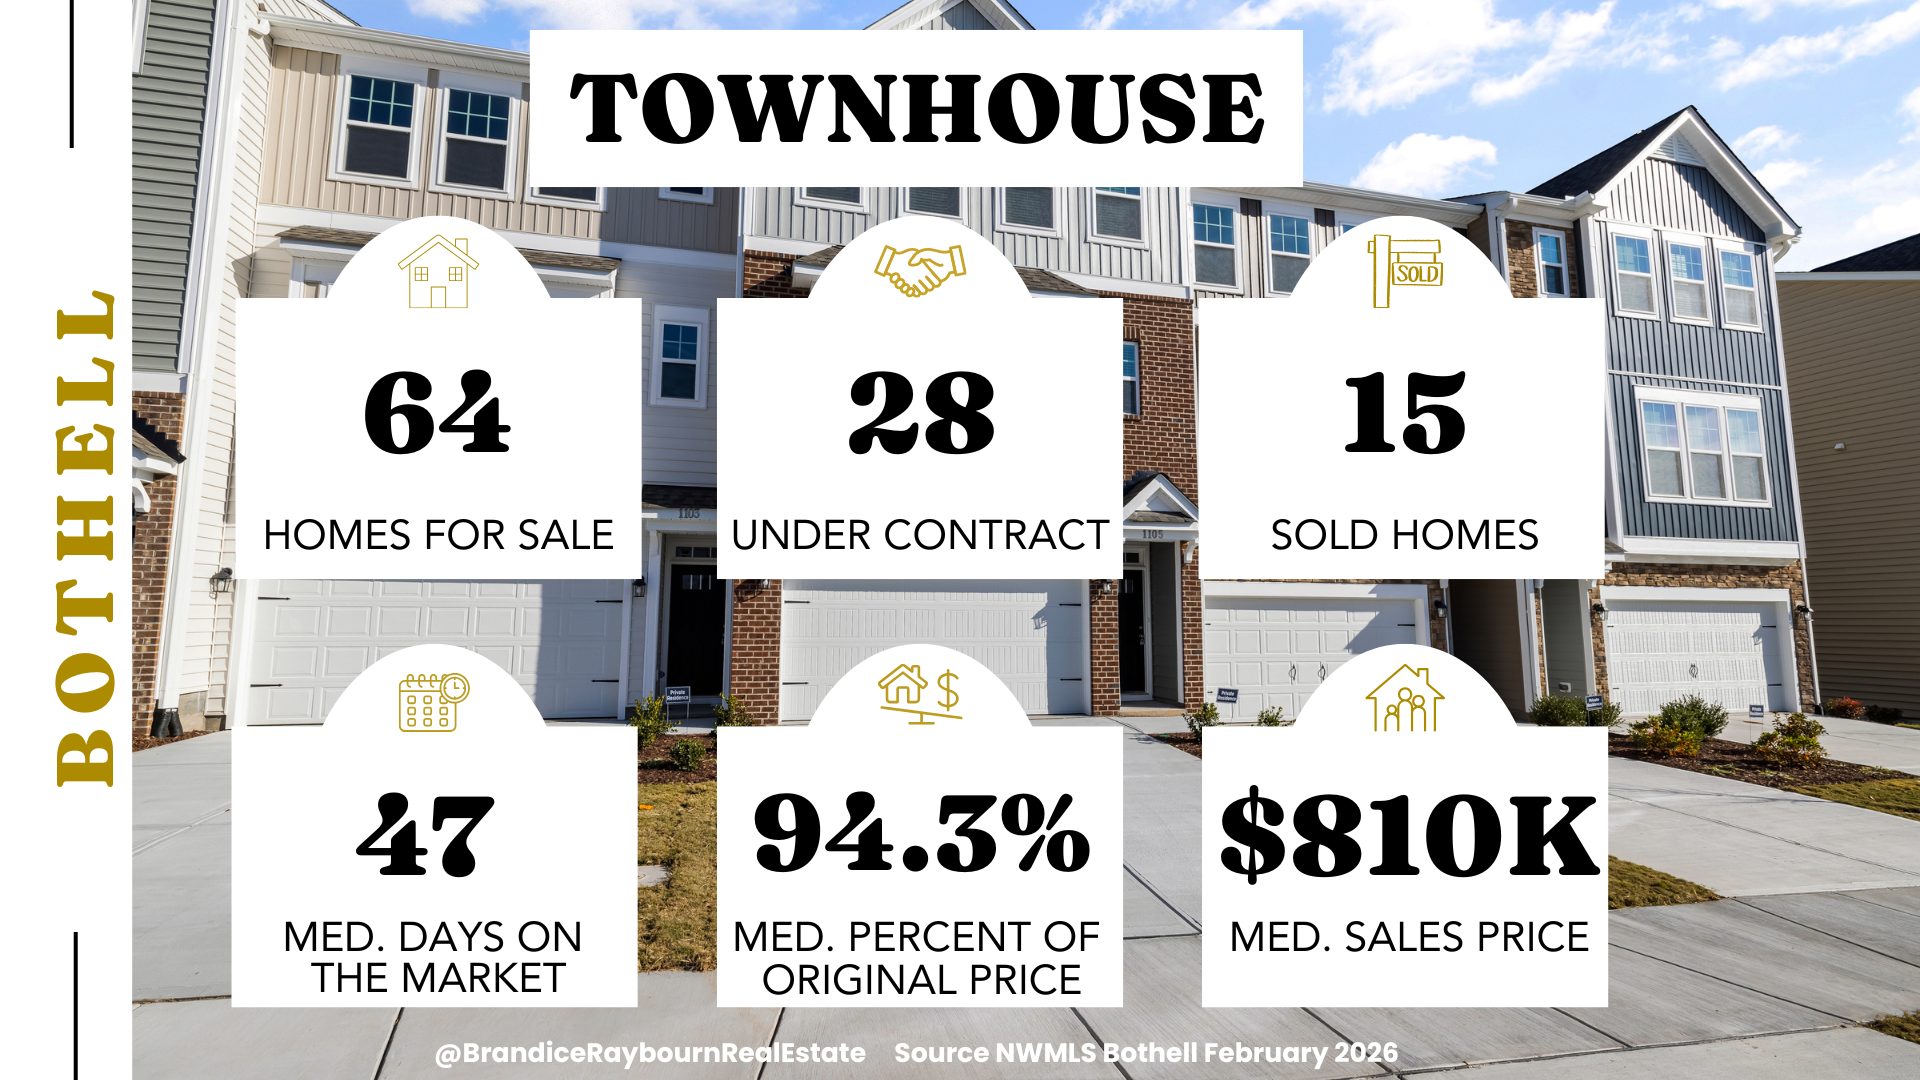
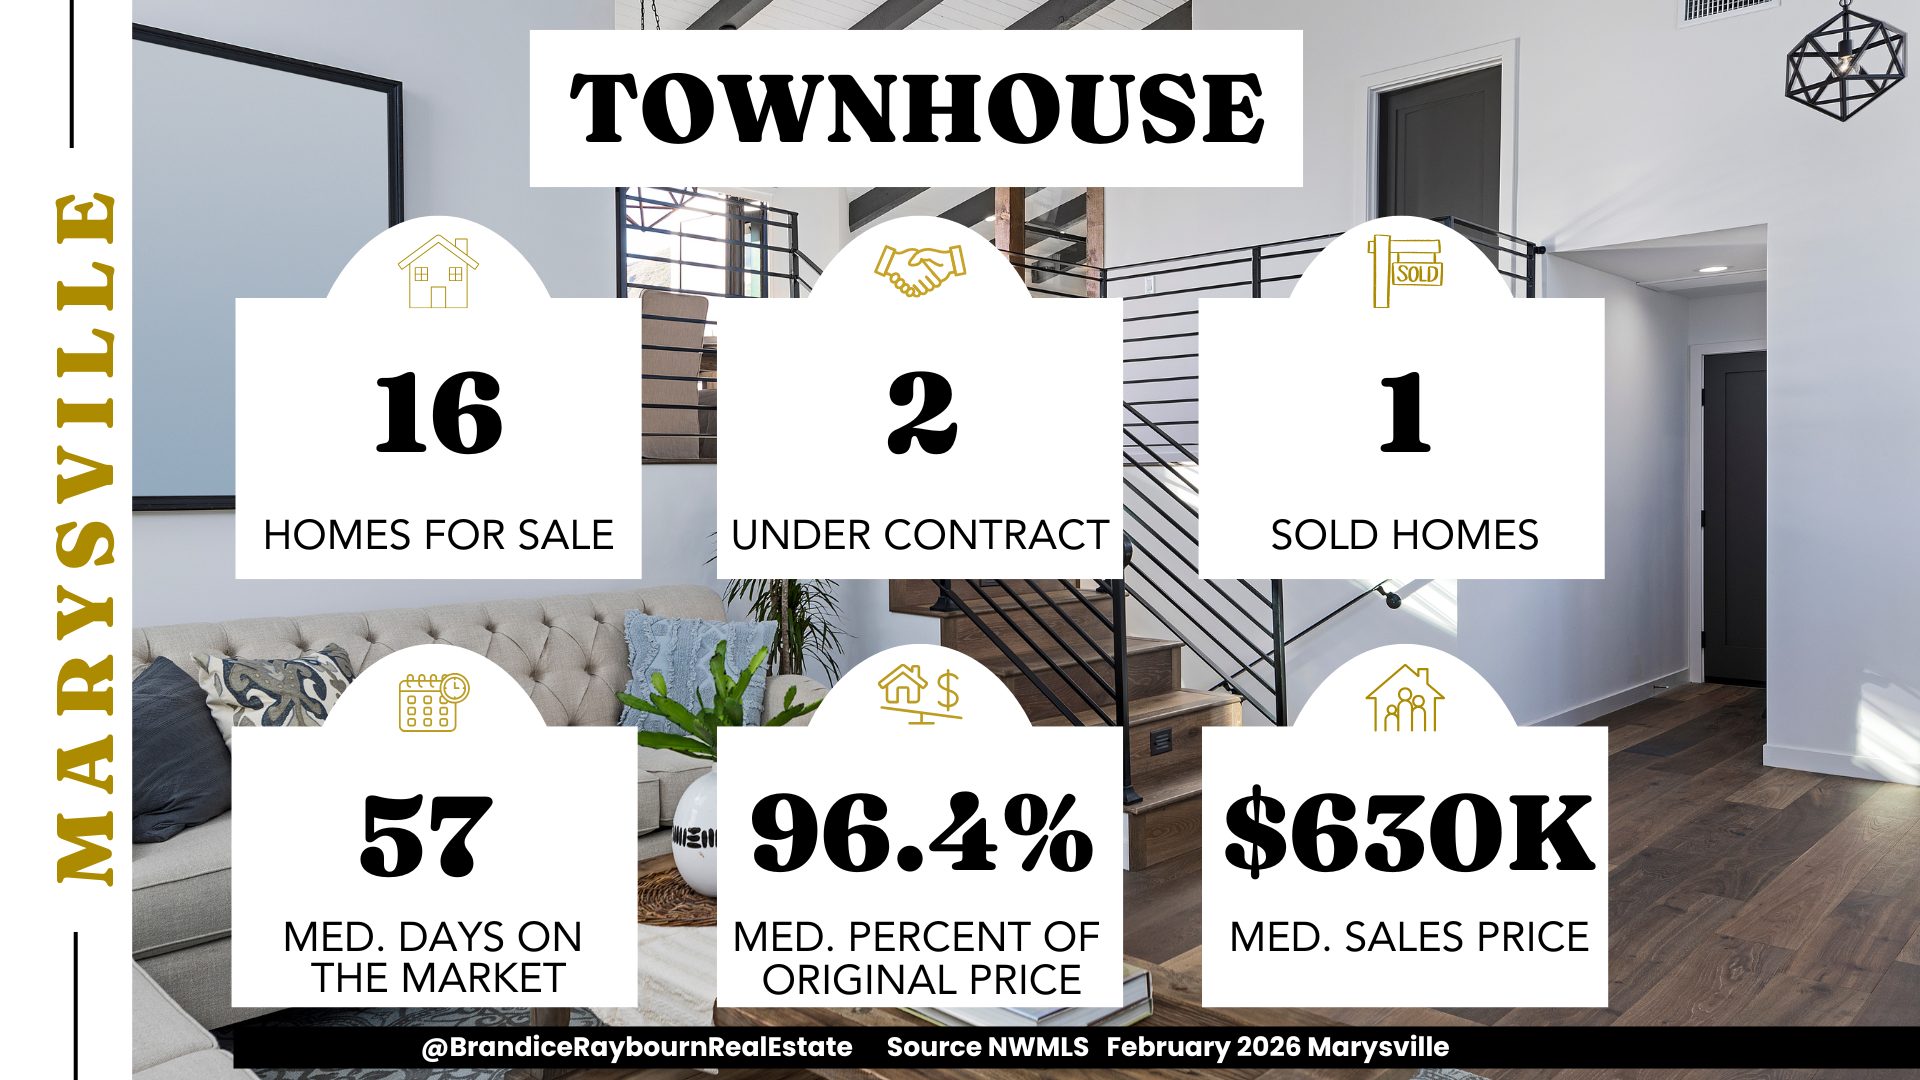
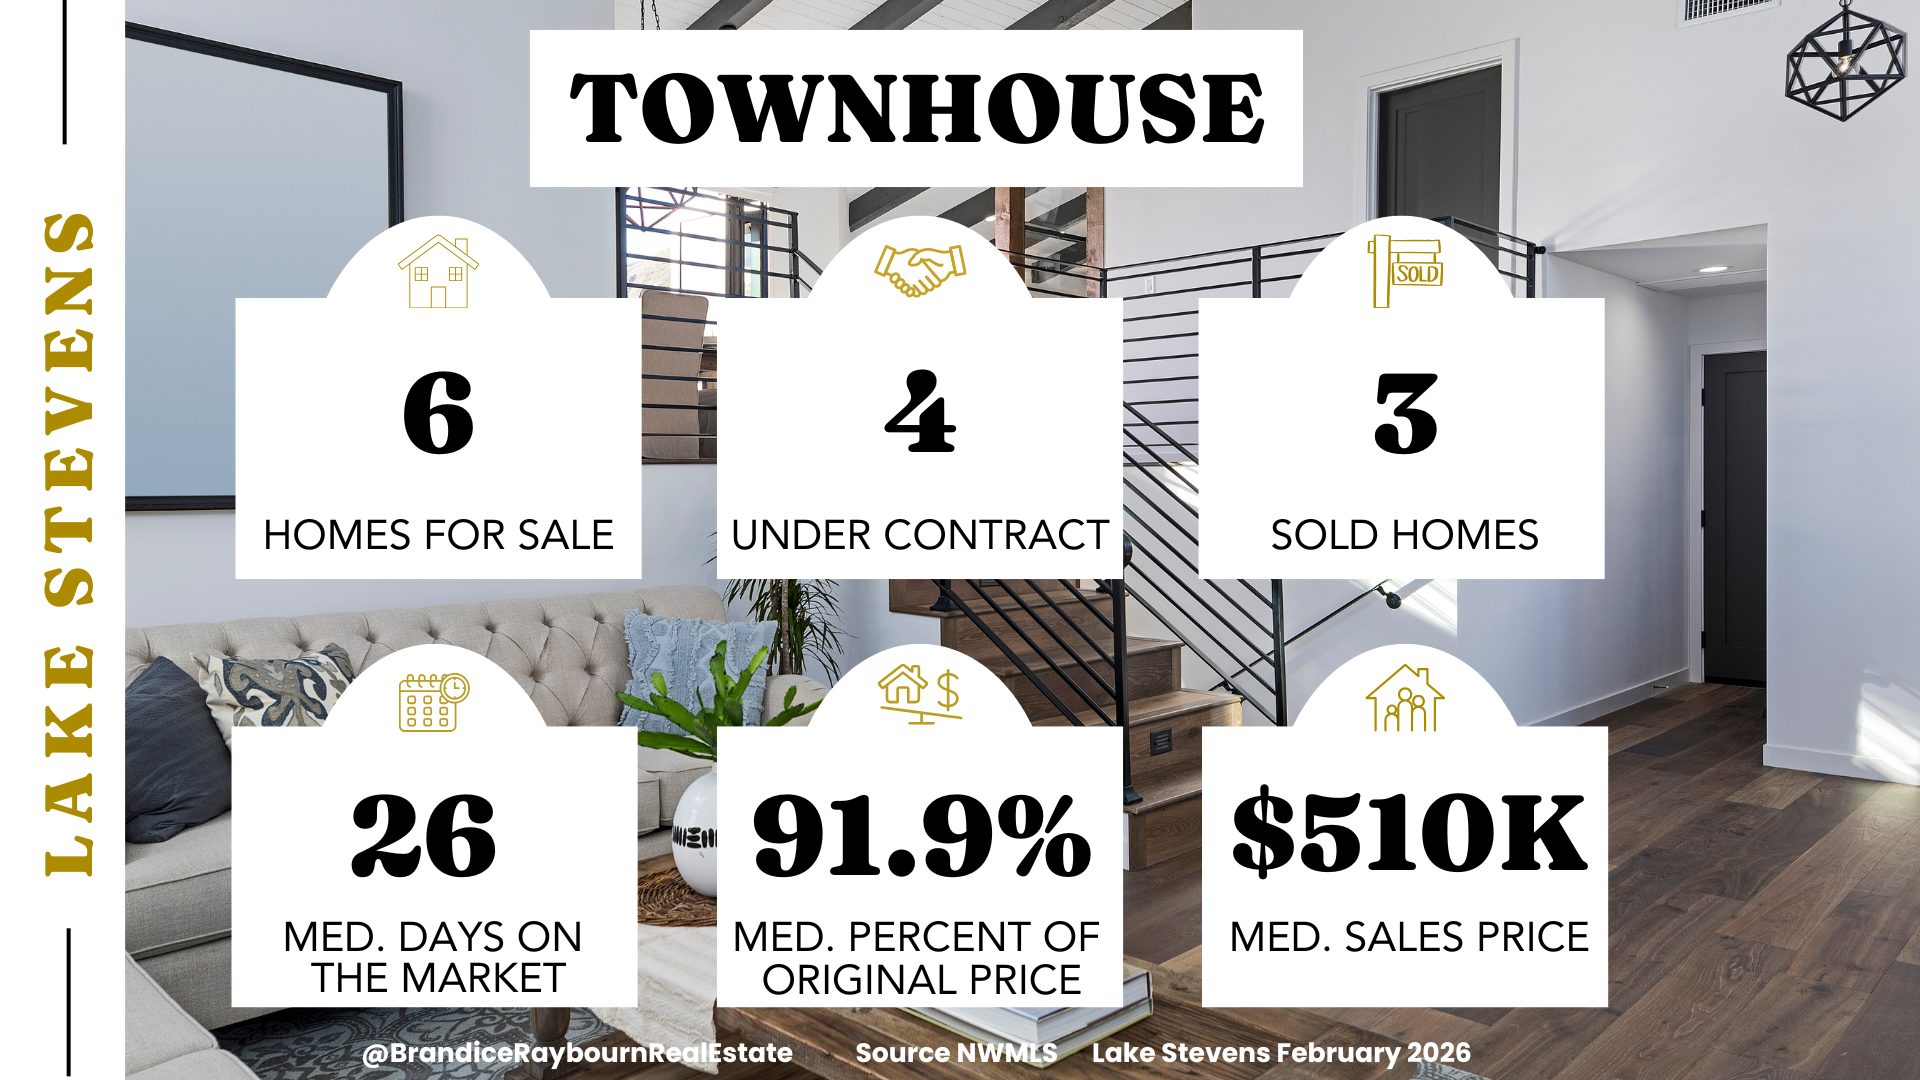
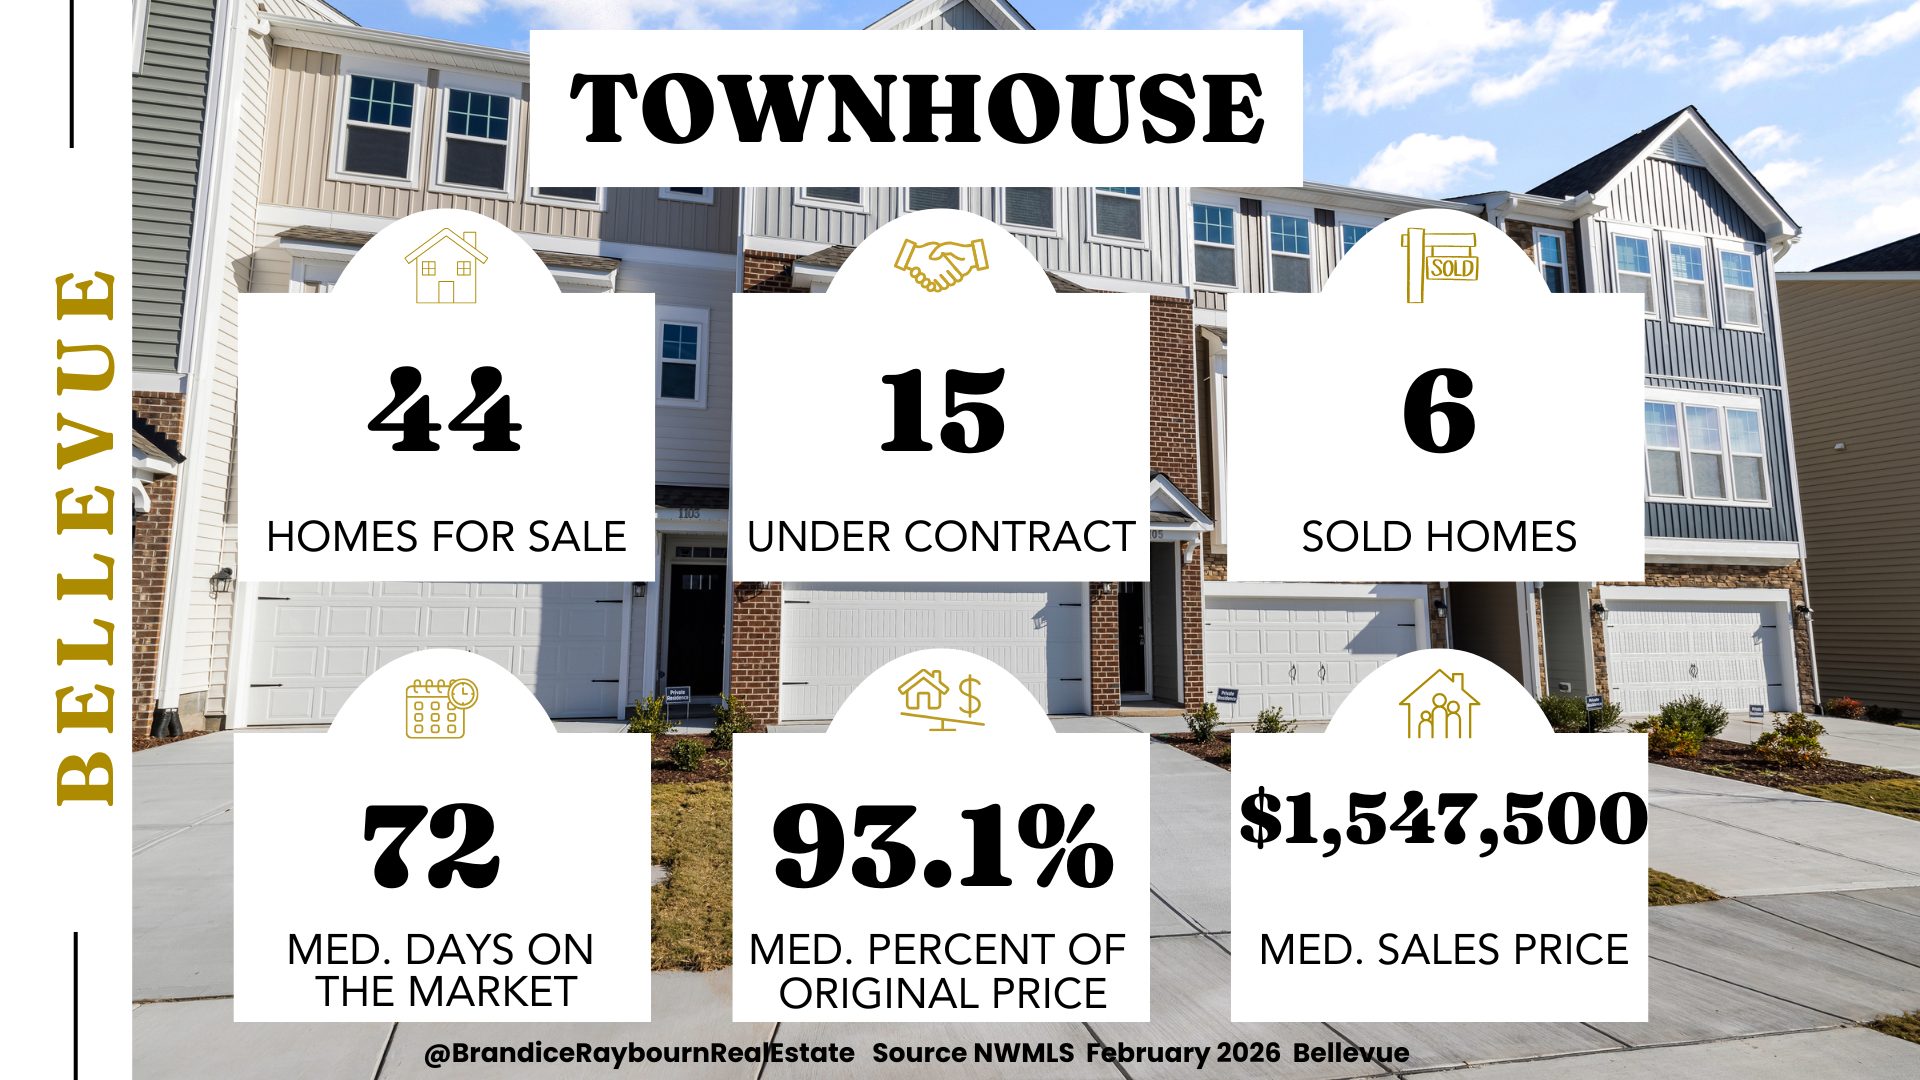
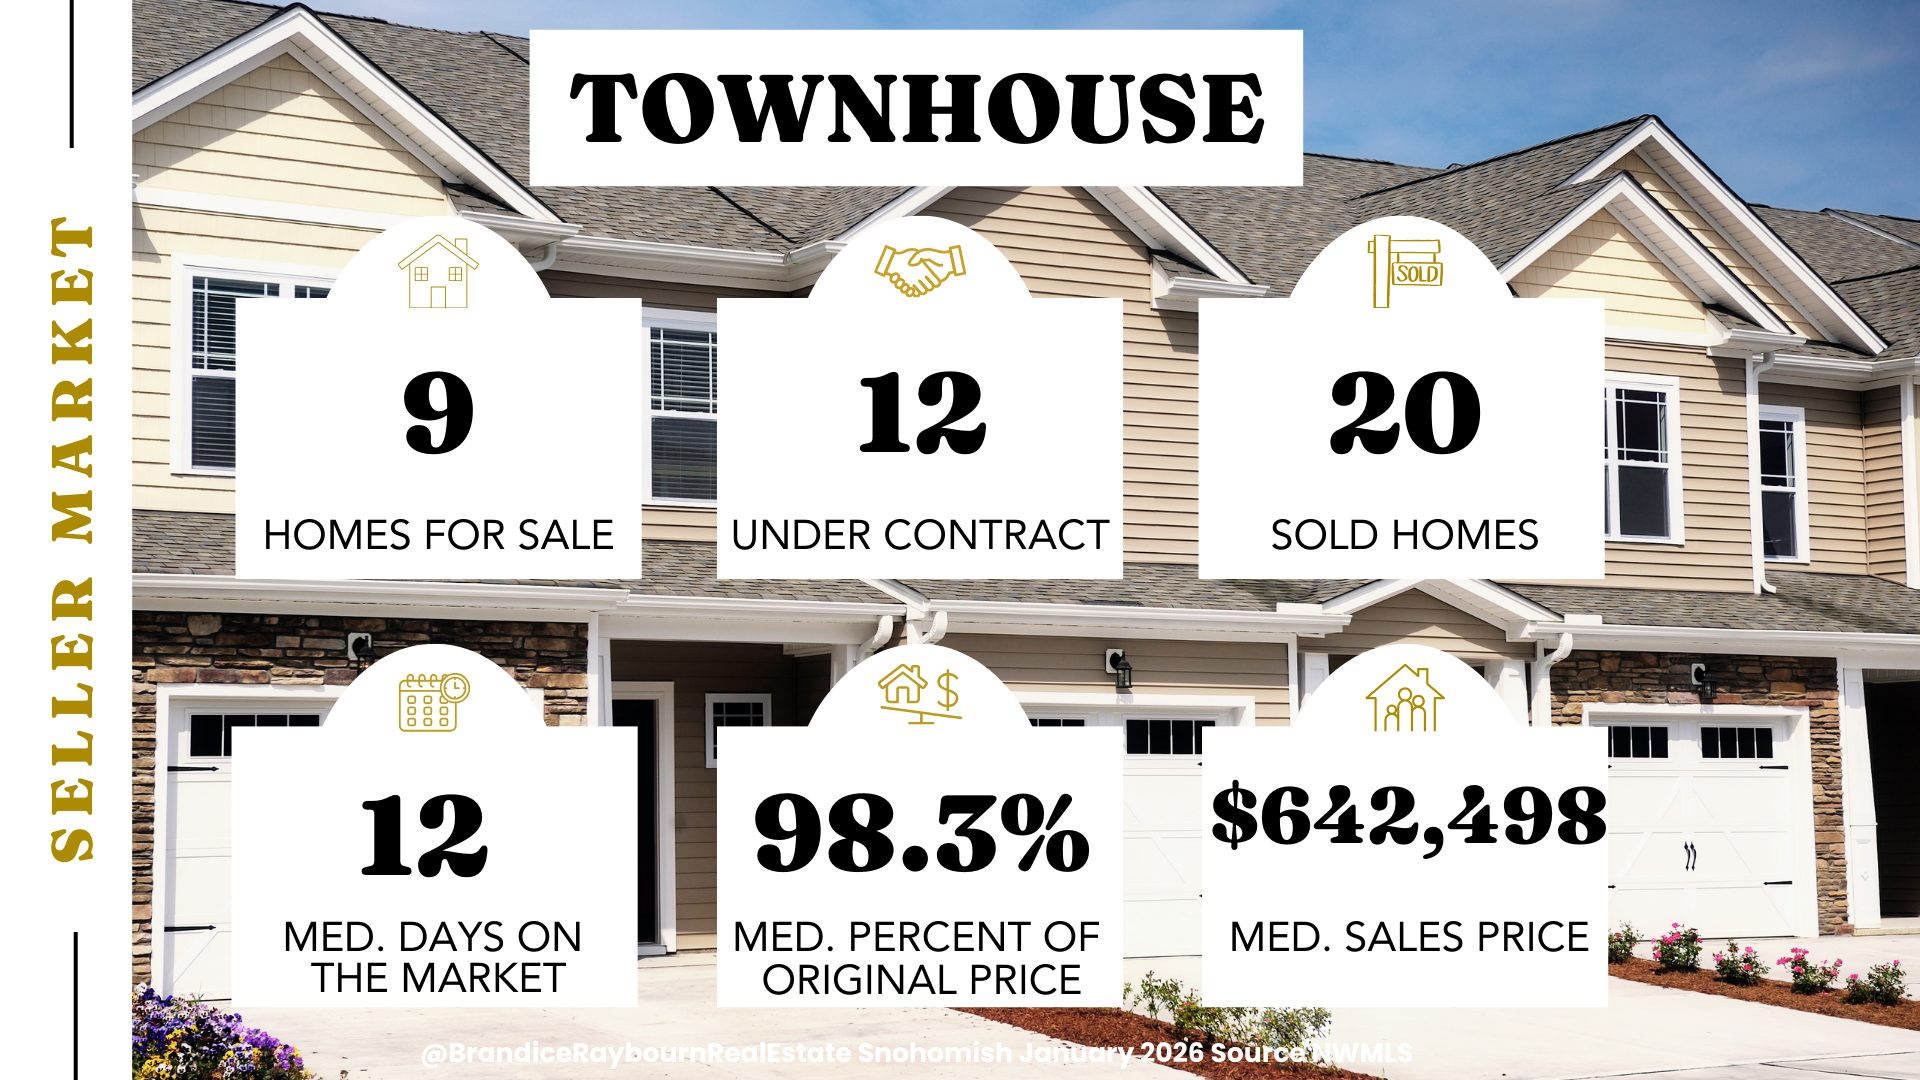
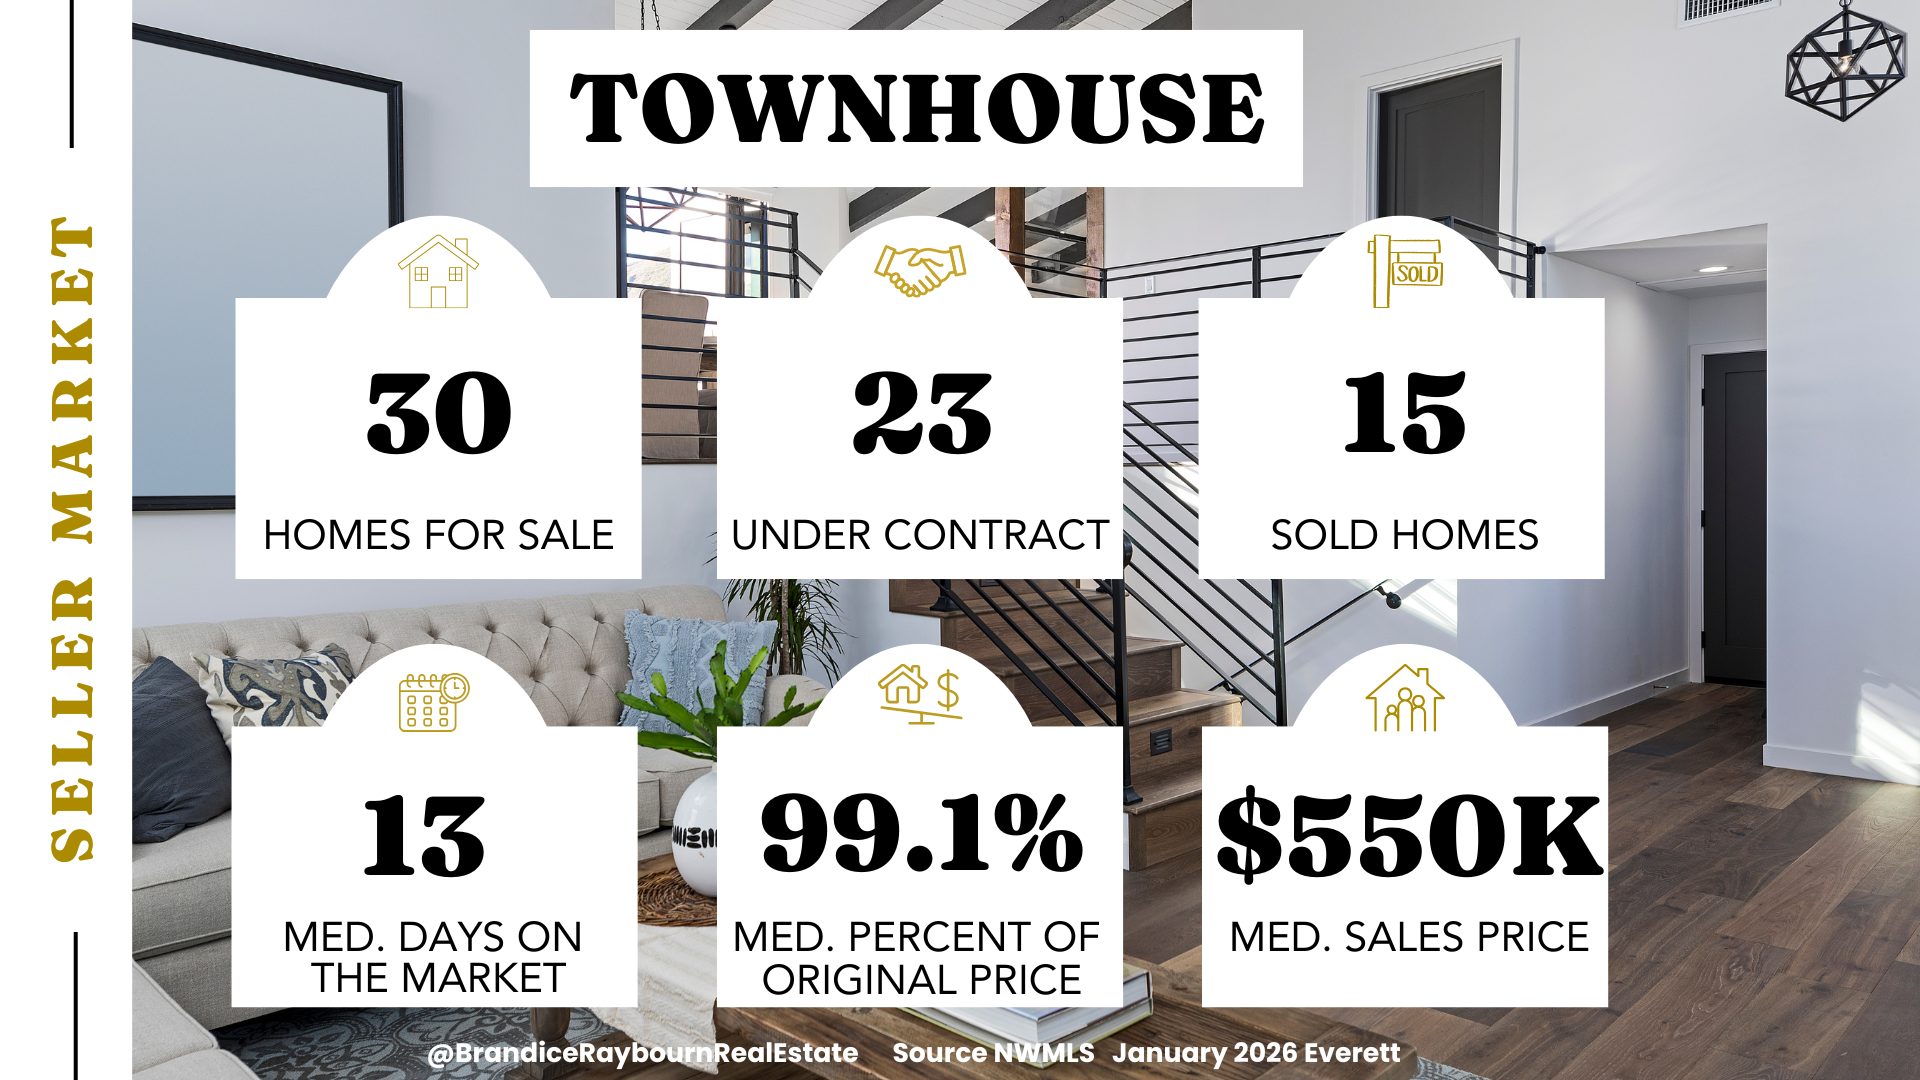
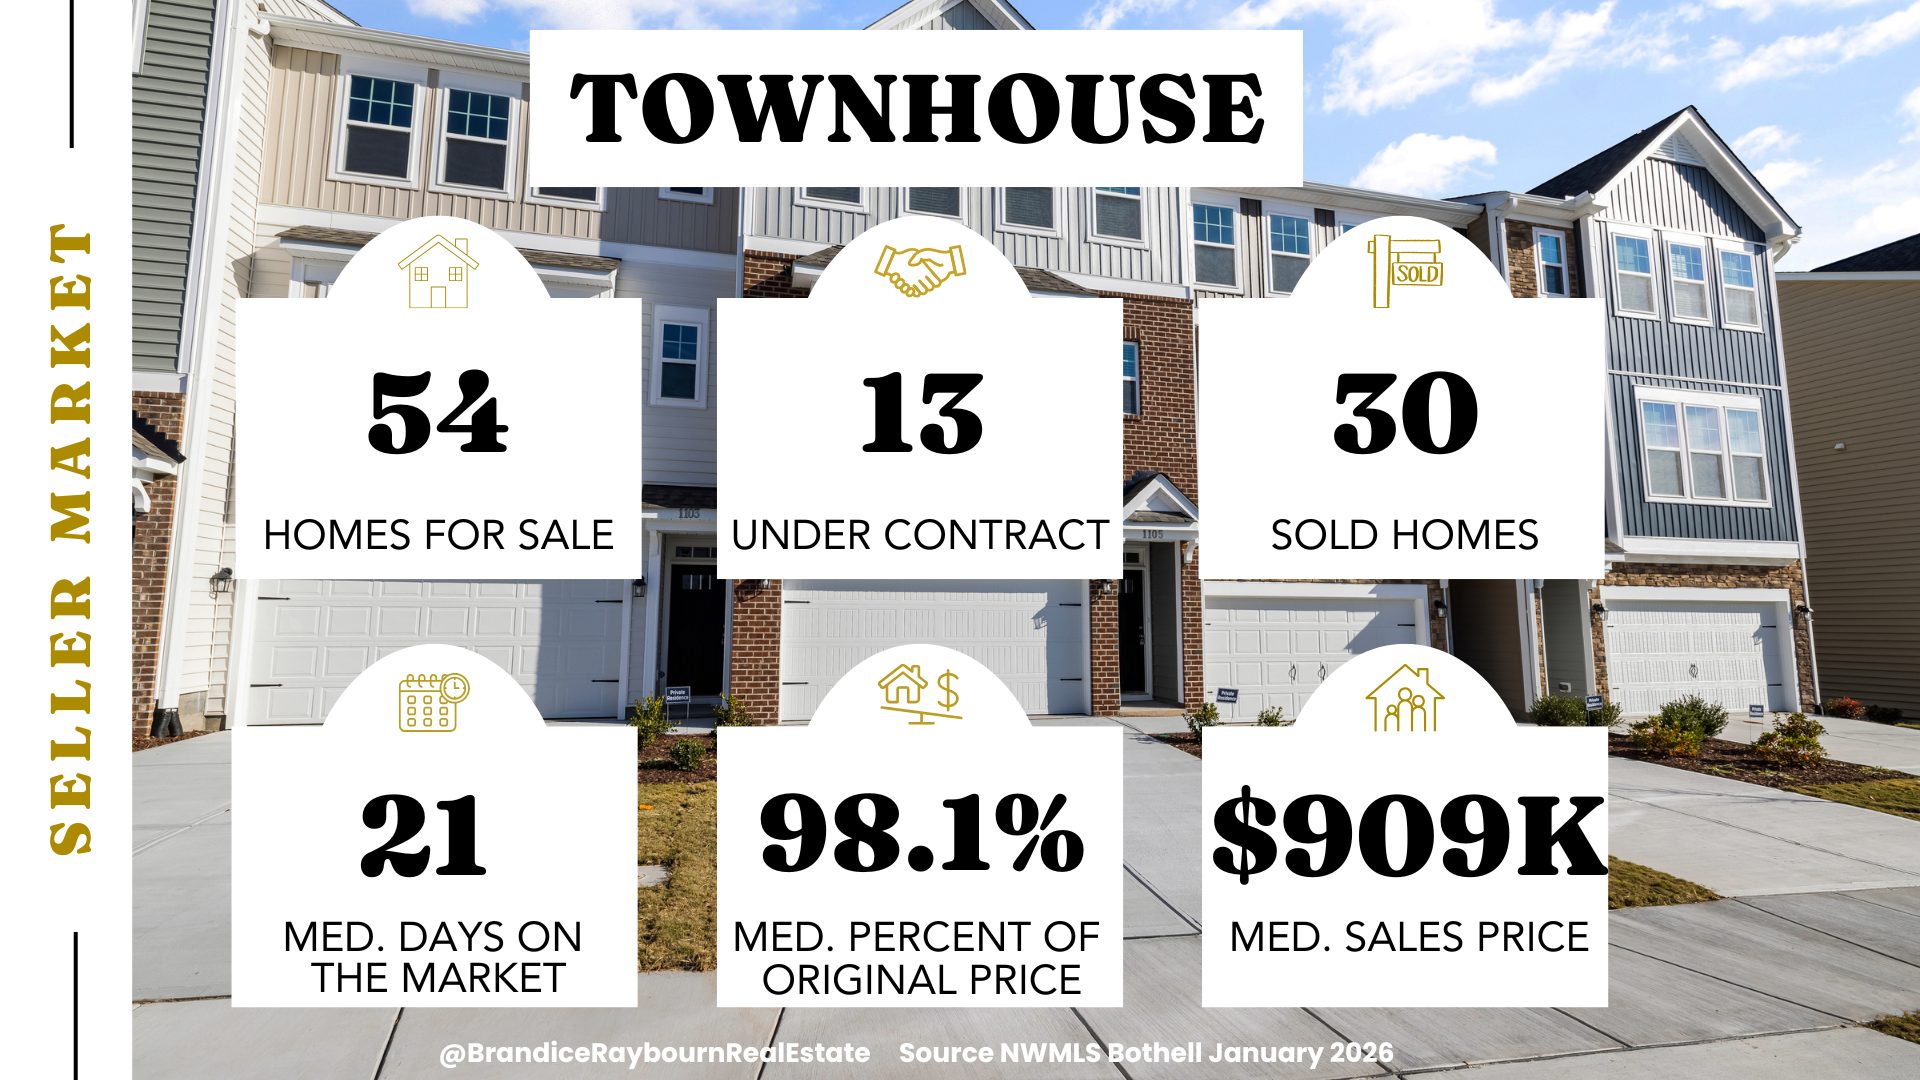
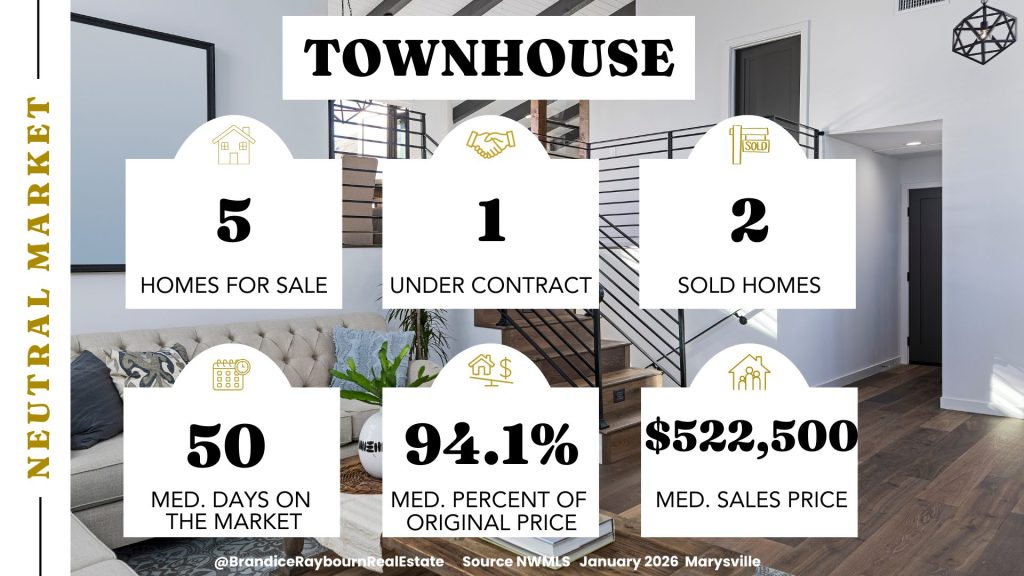
Townhomes
Townhomes continue to perform relatively well compared to other housing types, but they are not immune to the seasonal slowdown. Buyer interest remains steady, especially among those looking for lower maintenance than a detached home without moving into higher price points.
Well-priced townhomes are still selling. Others are taking longer as buyers compare options.
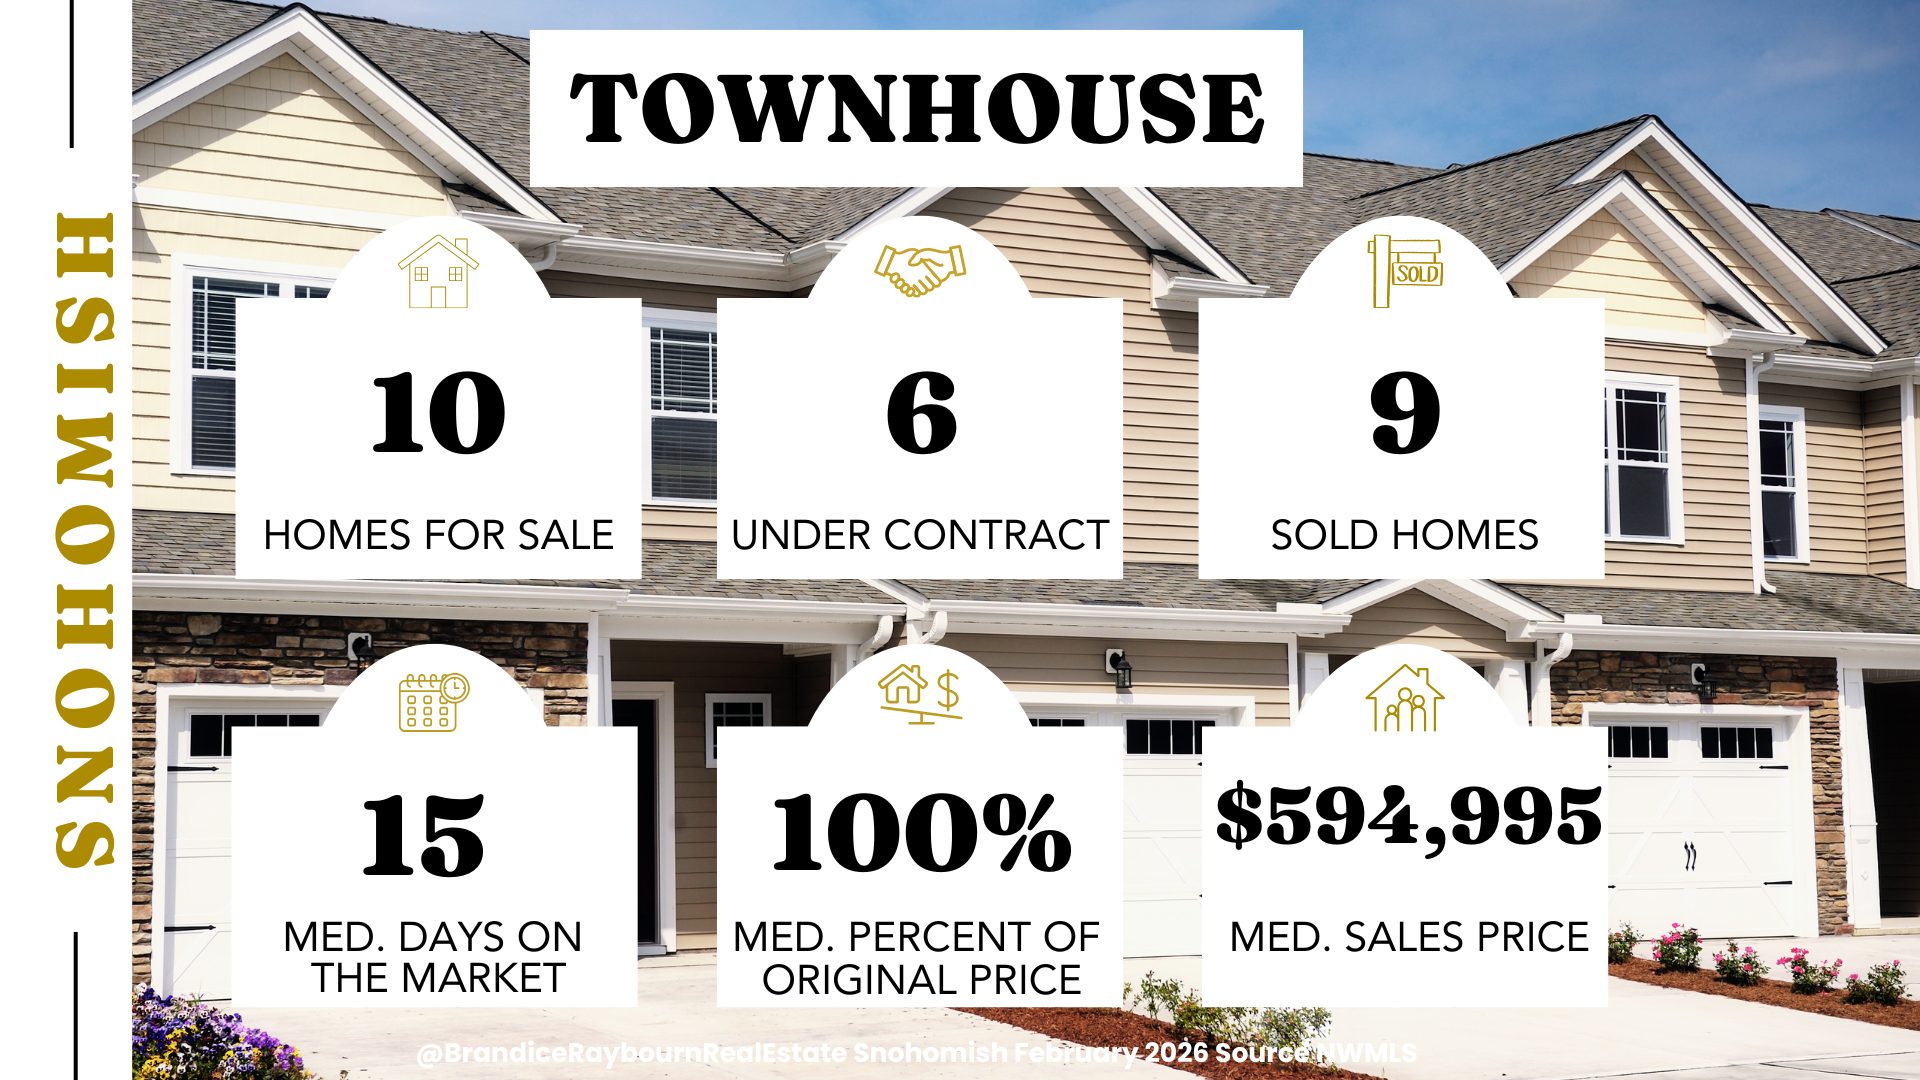
Source: NWMLS | Analysis by Brandice Raybourn
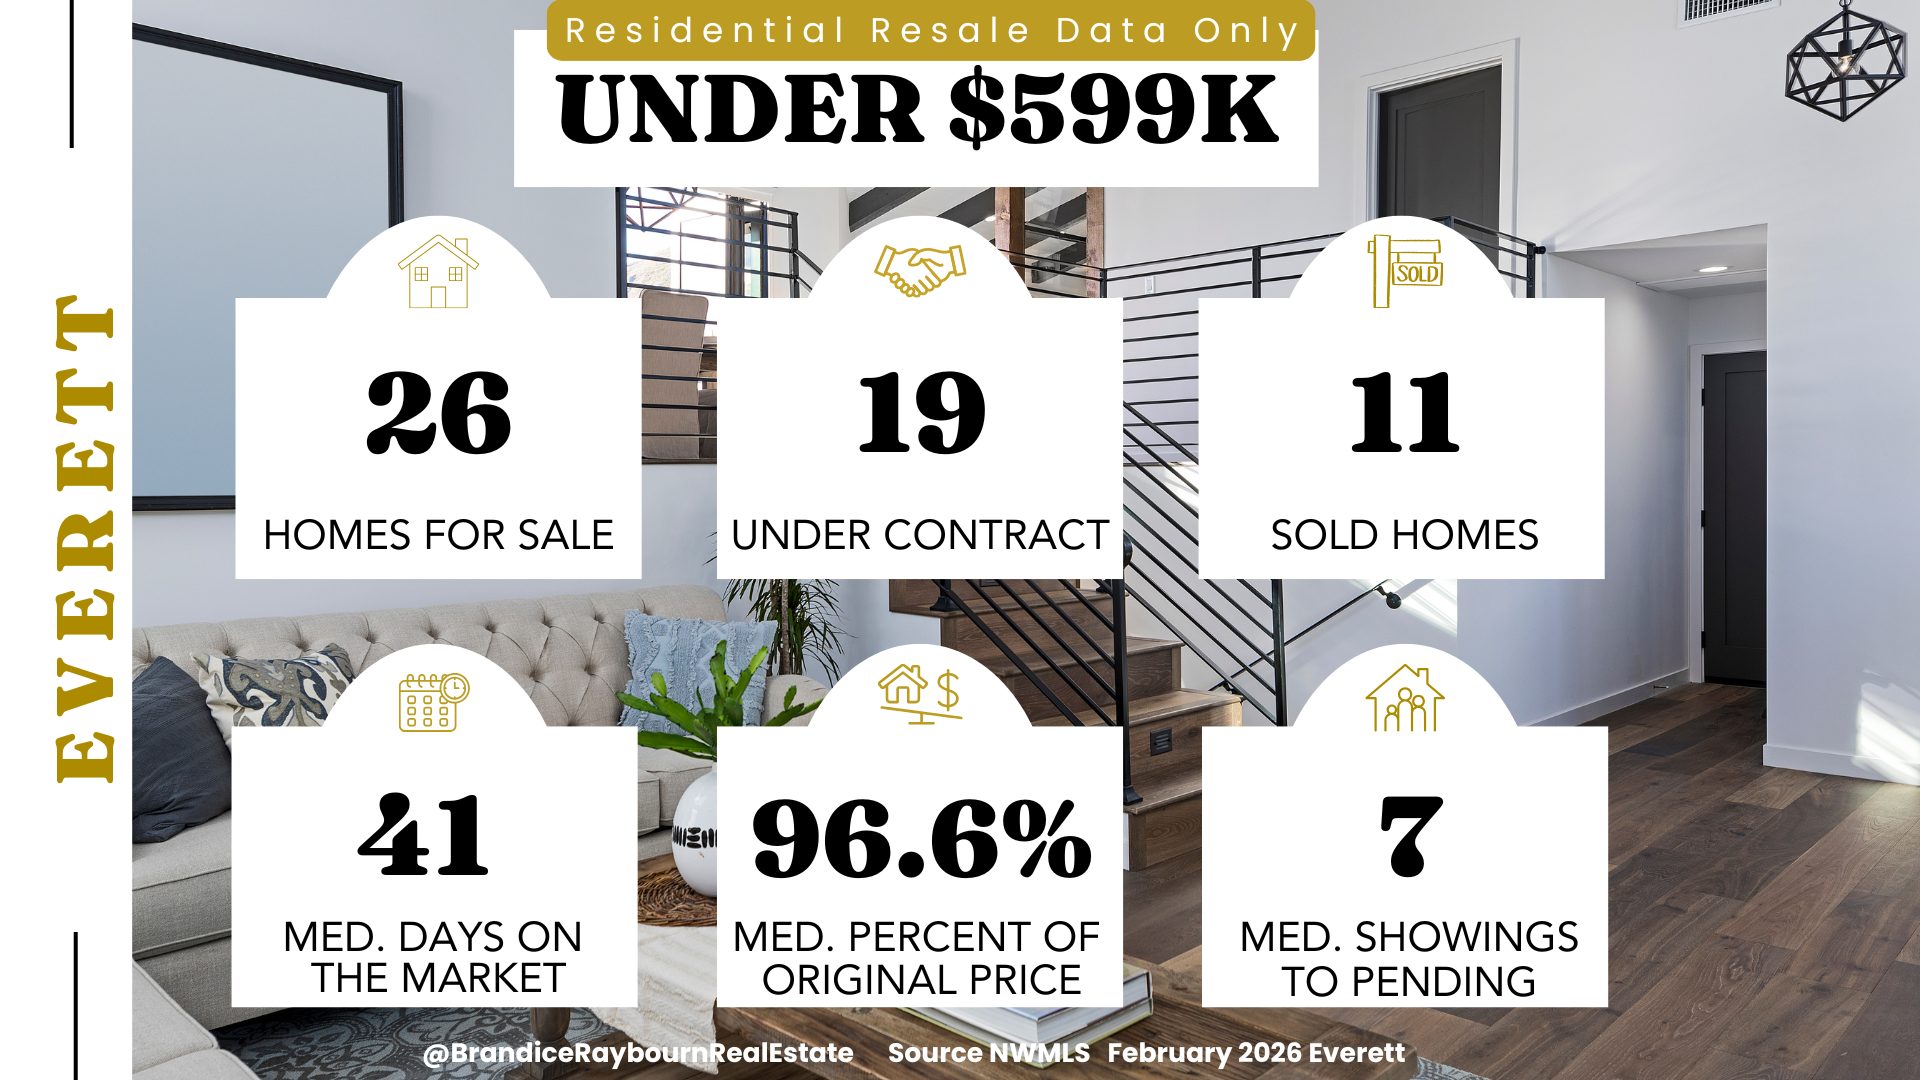
Residential Resale by Price Point
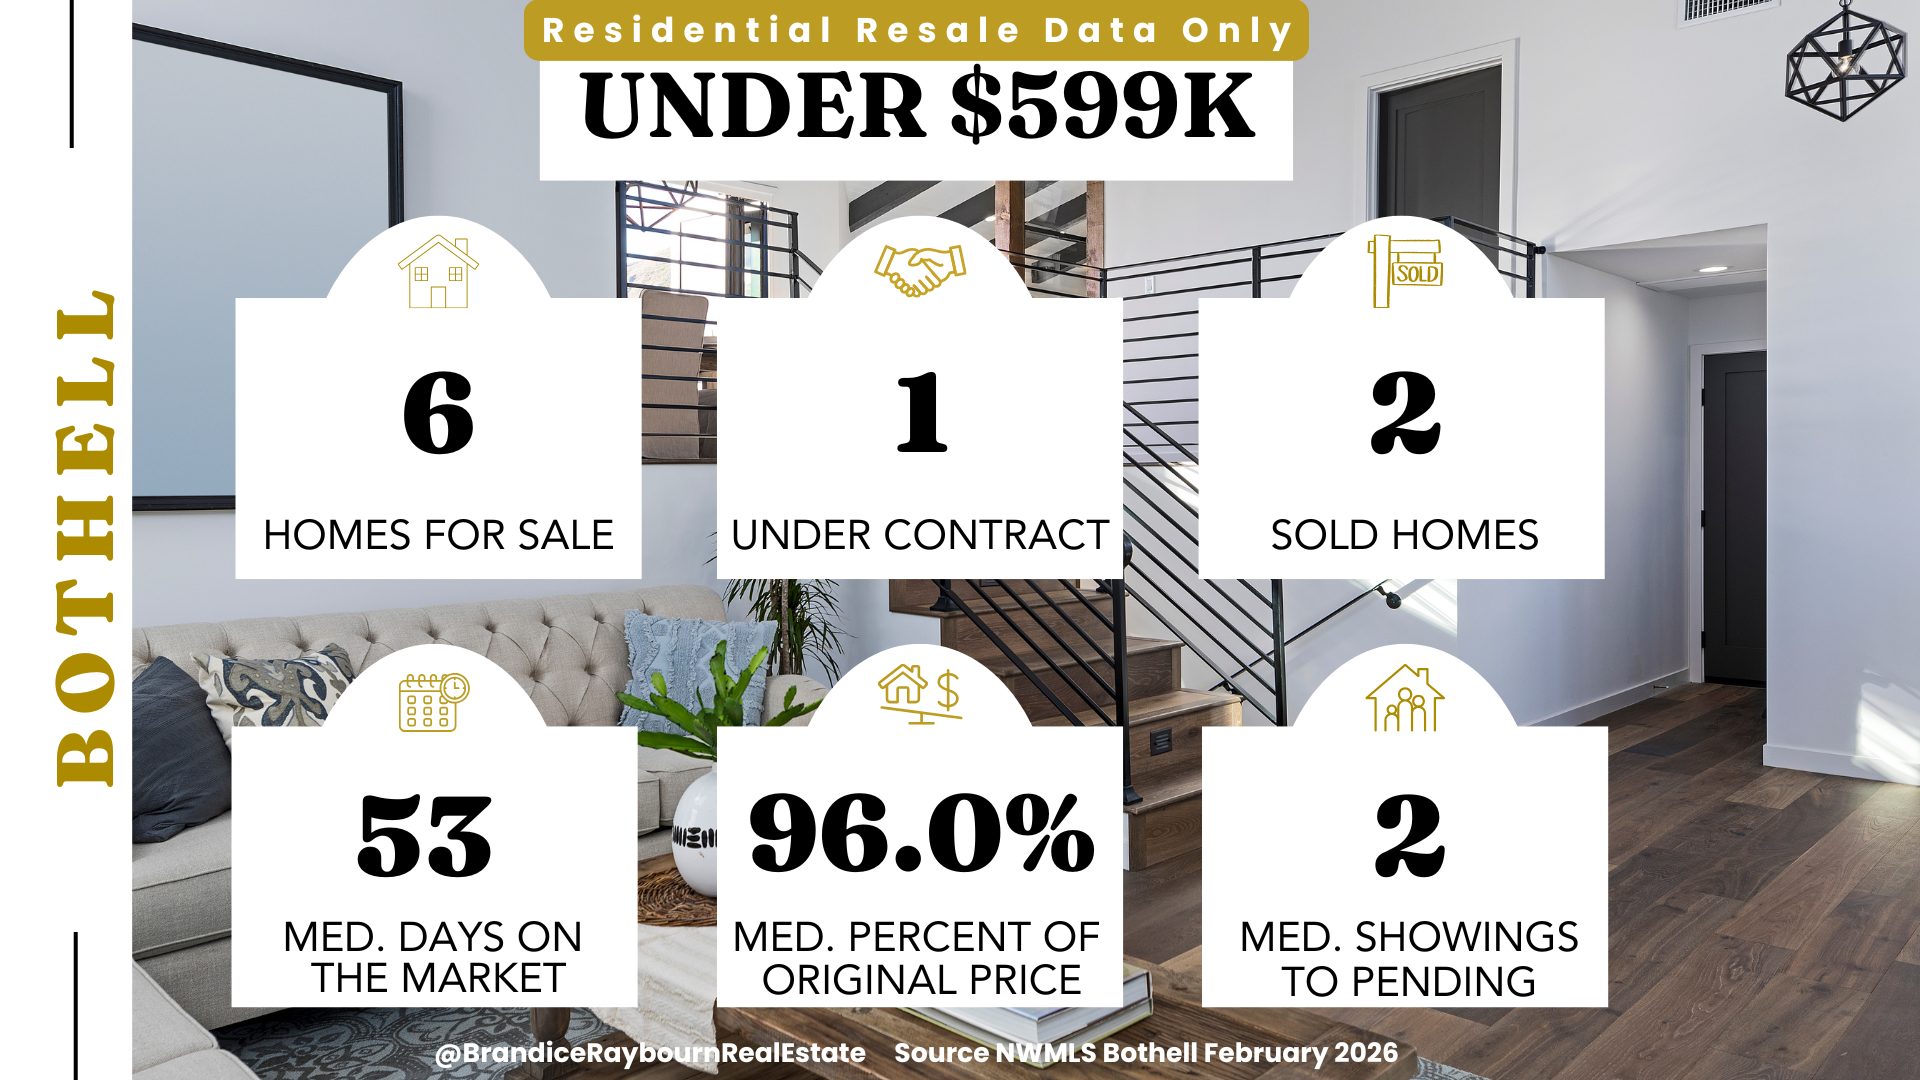
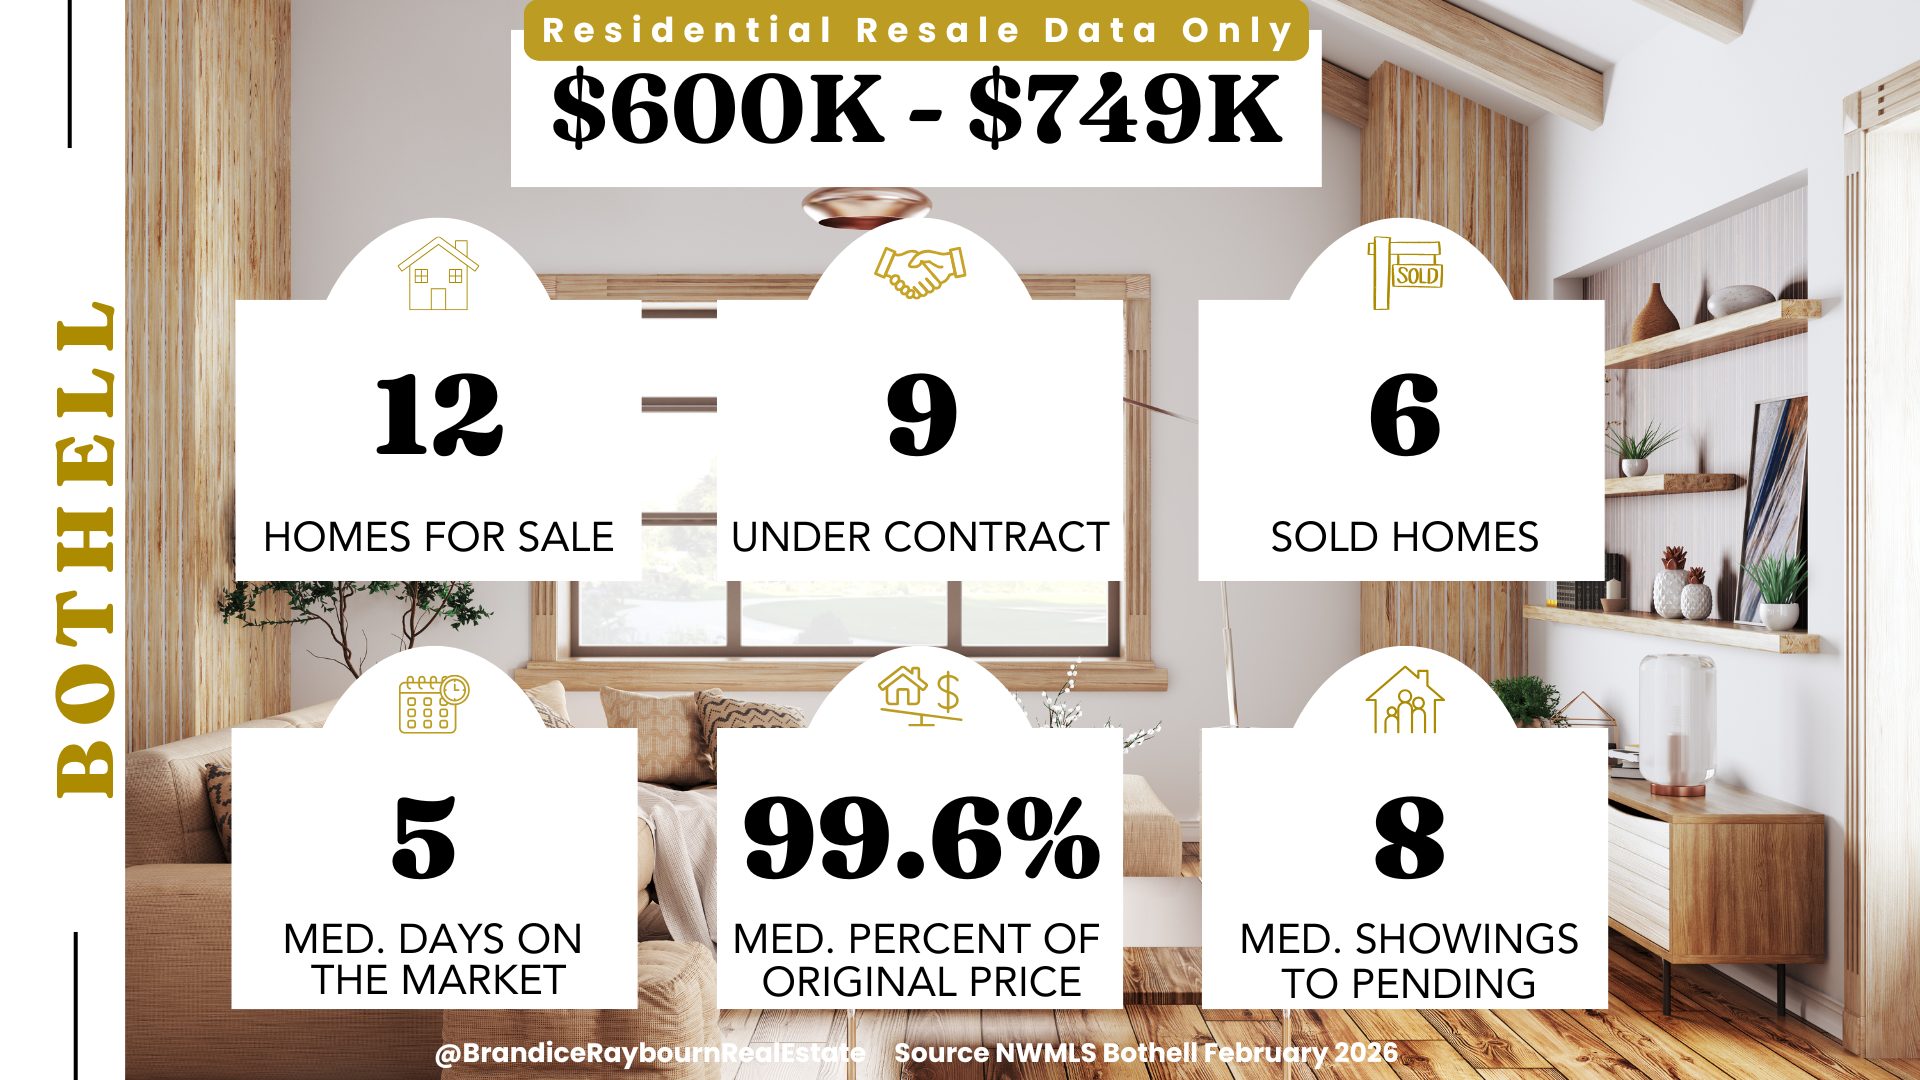
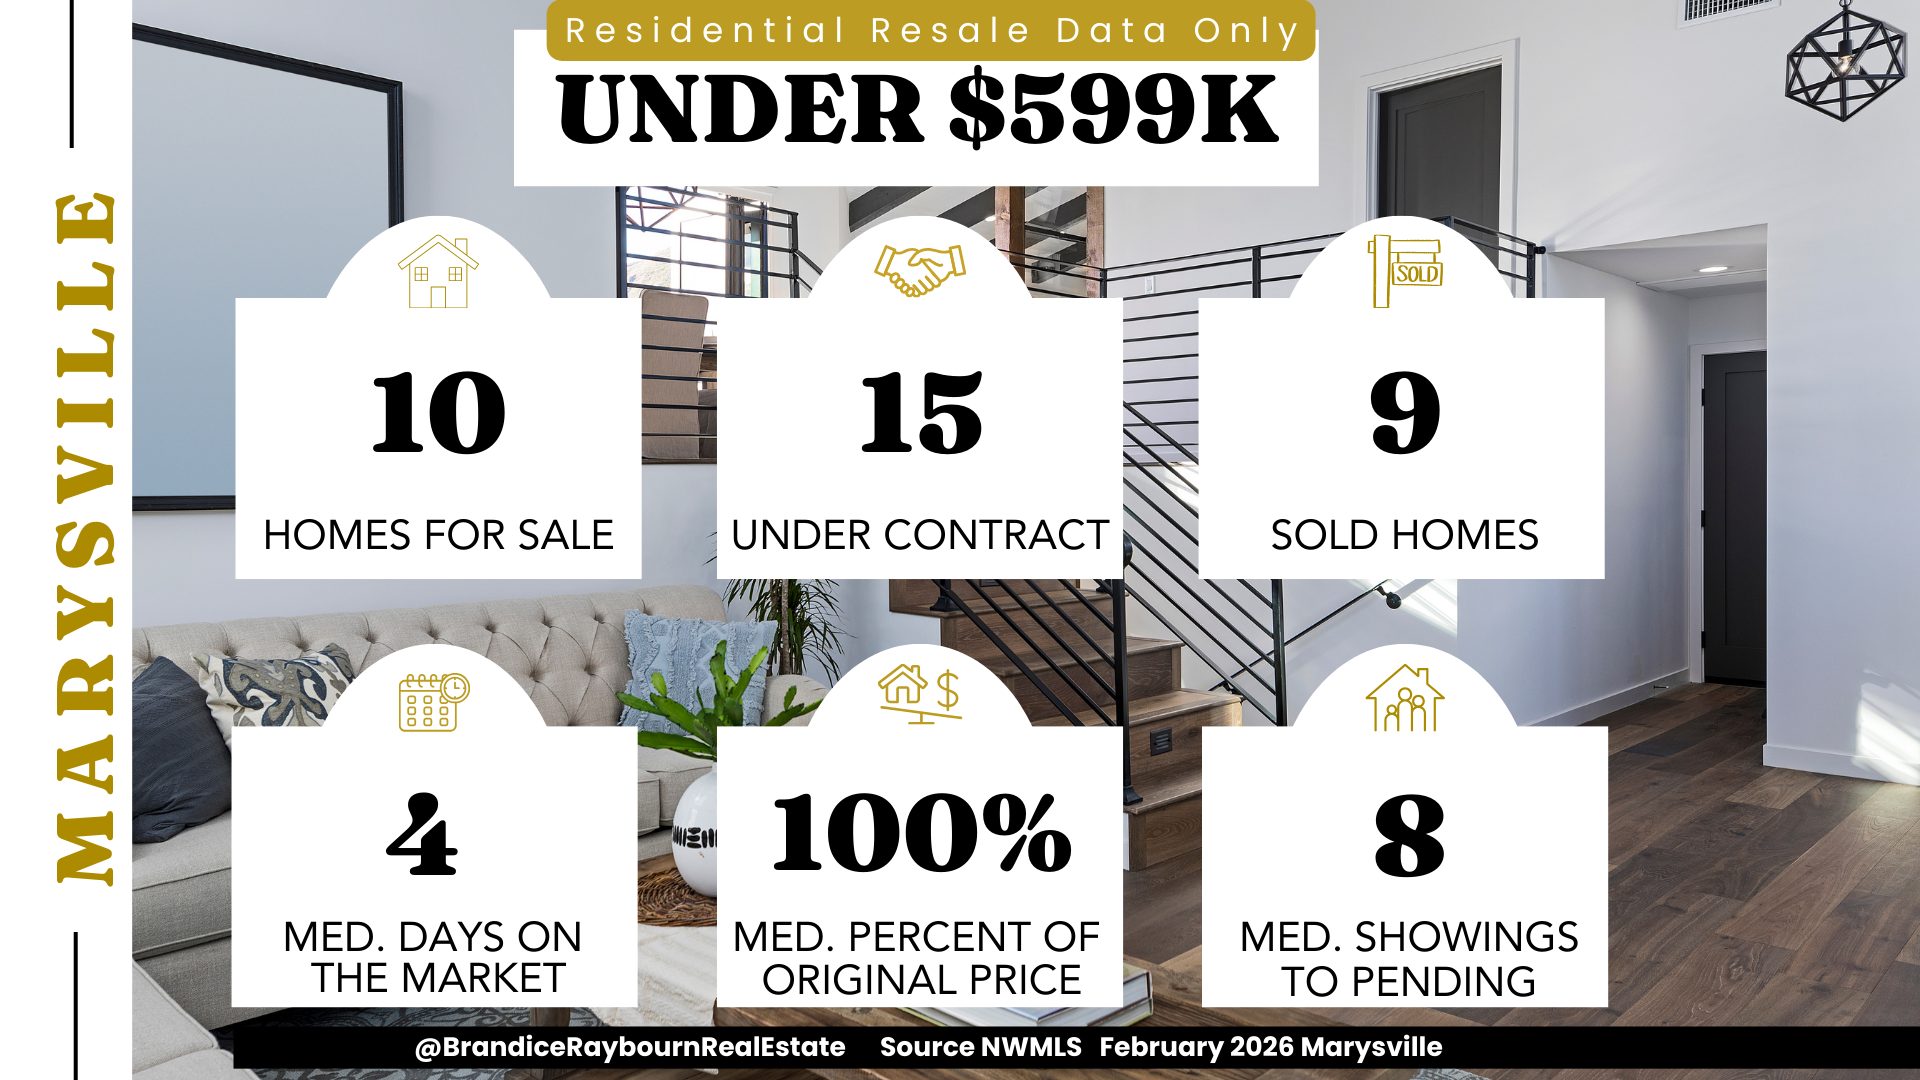
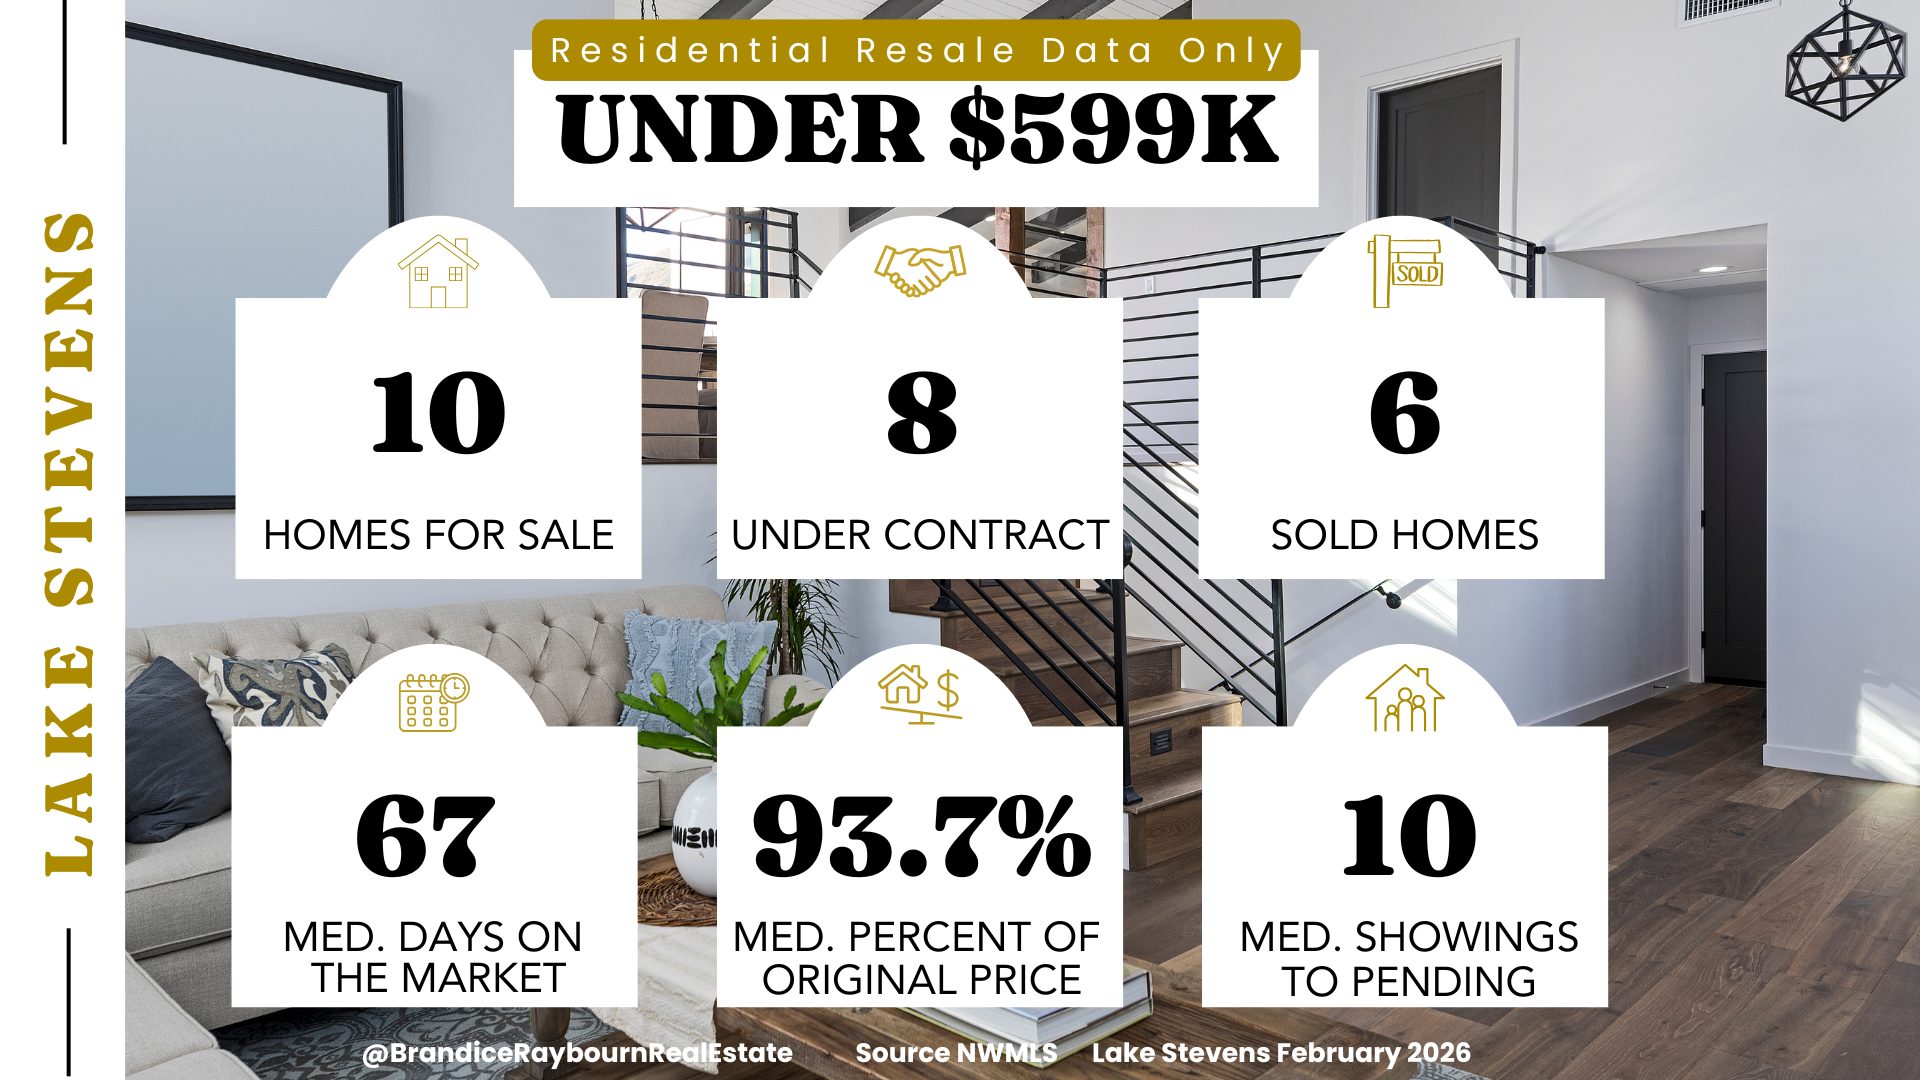
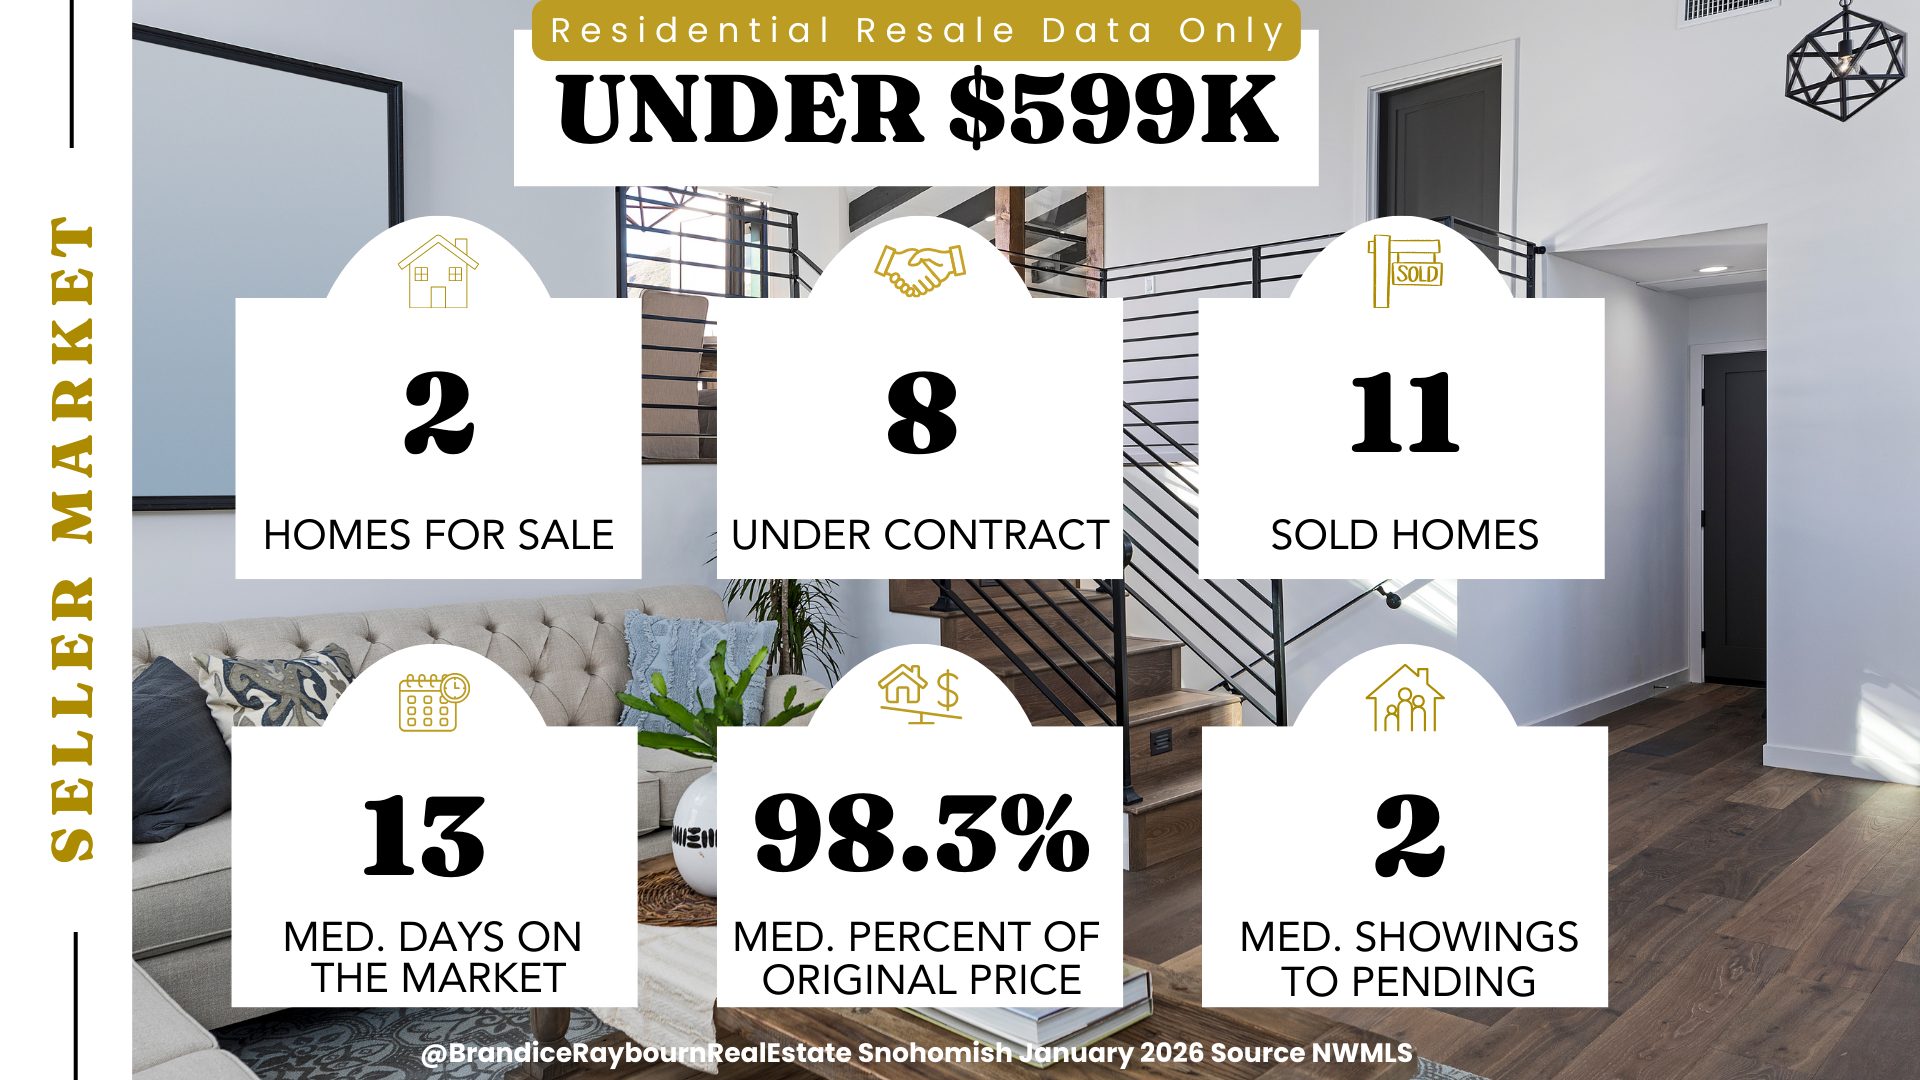
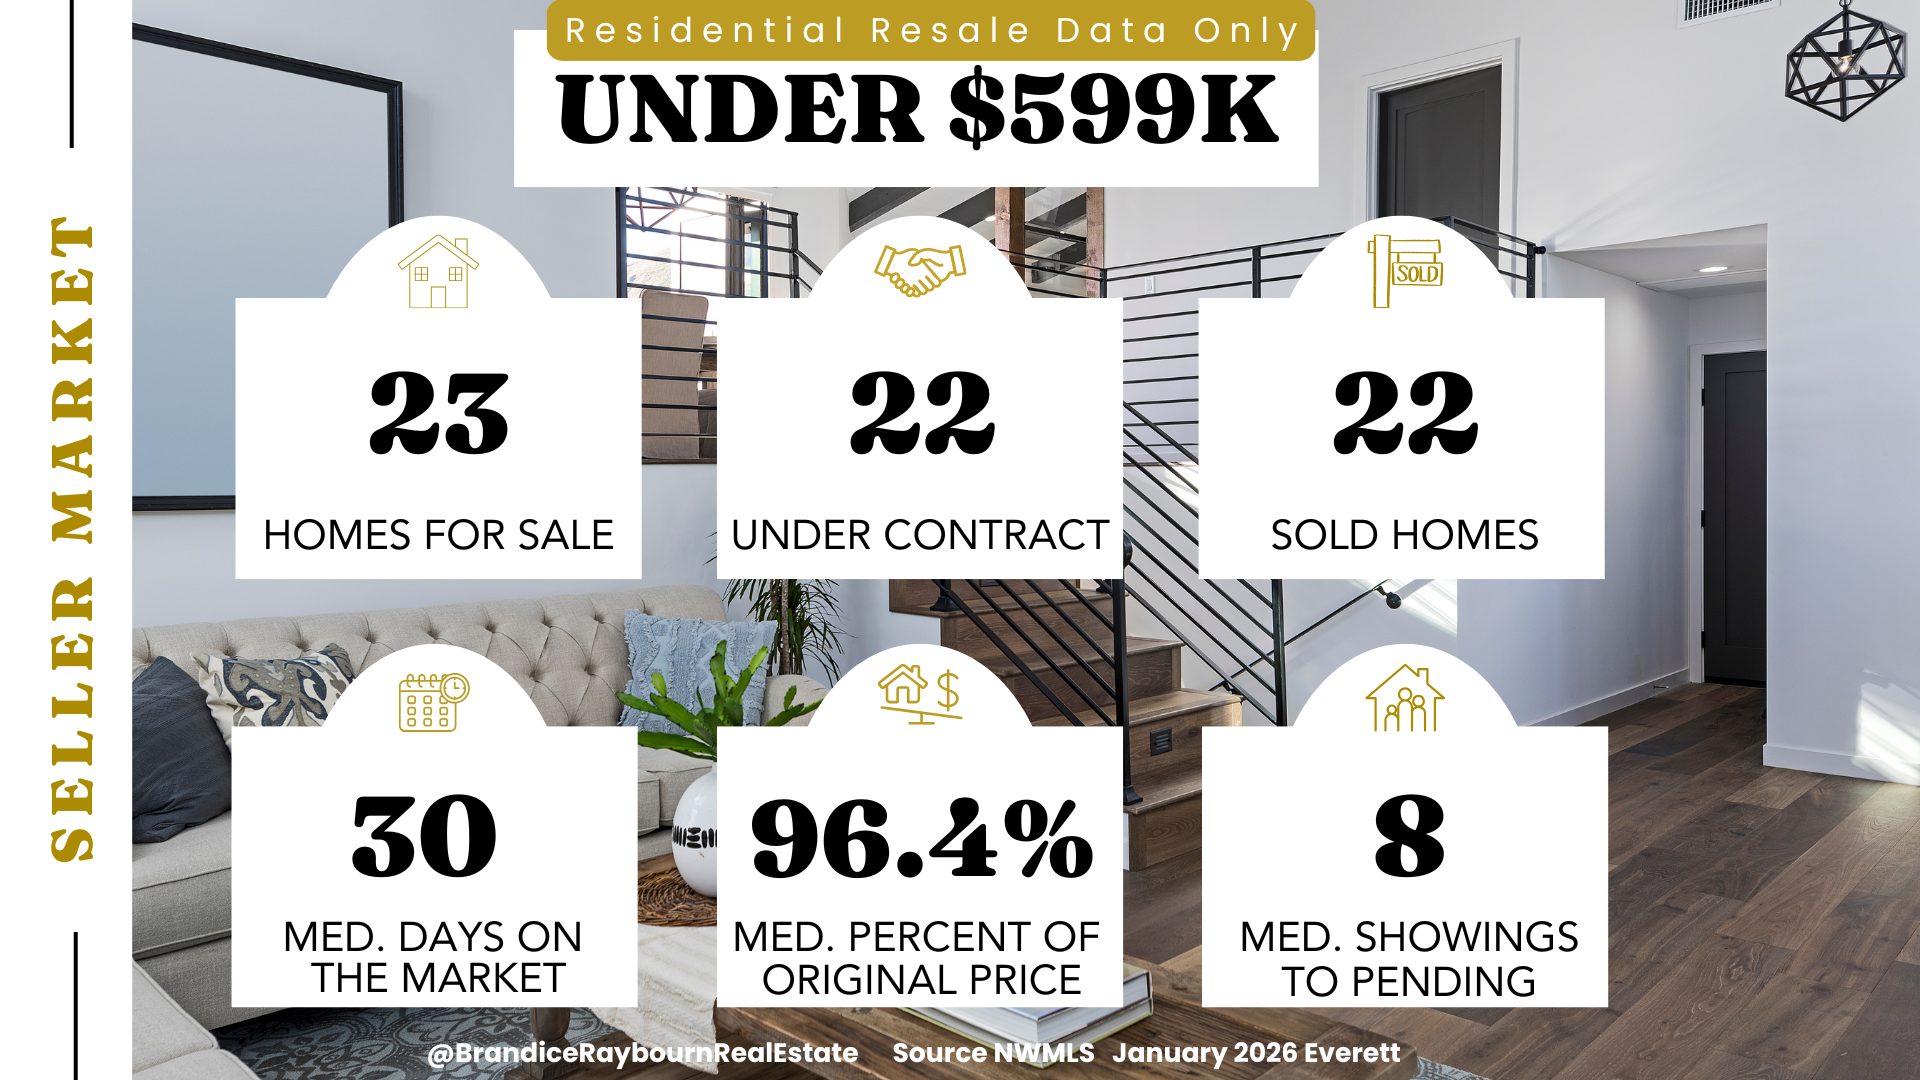
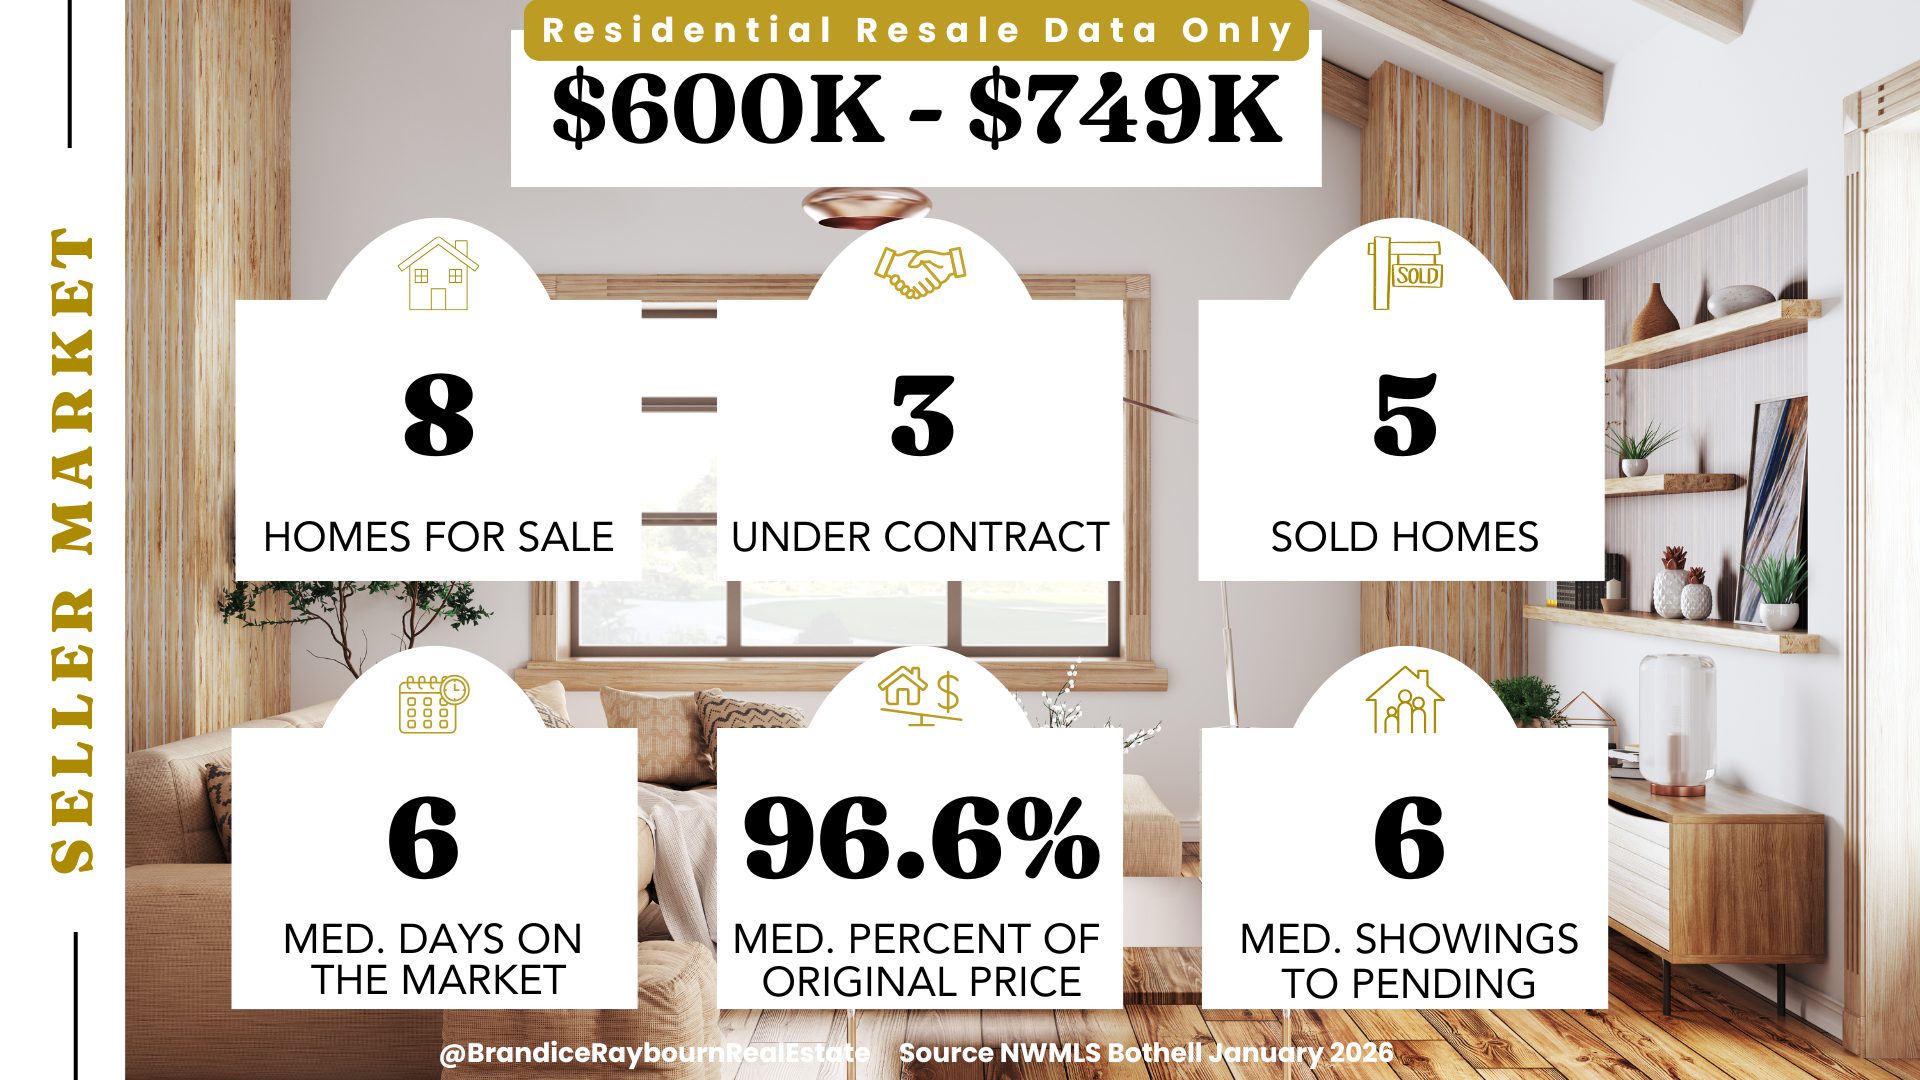
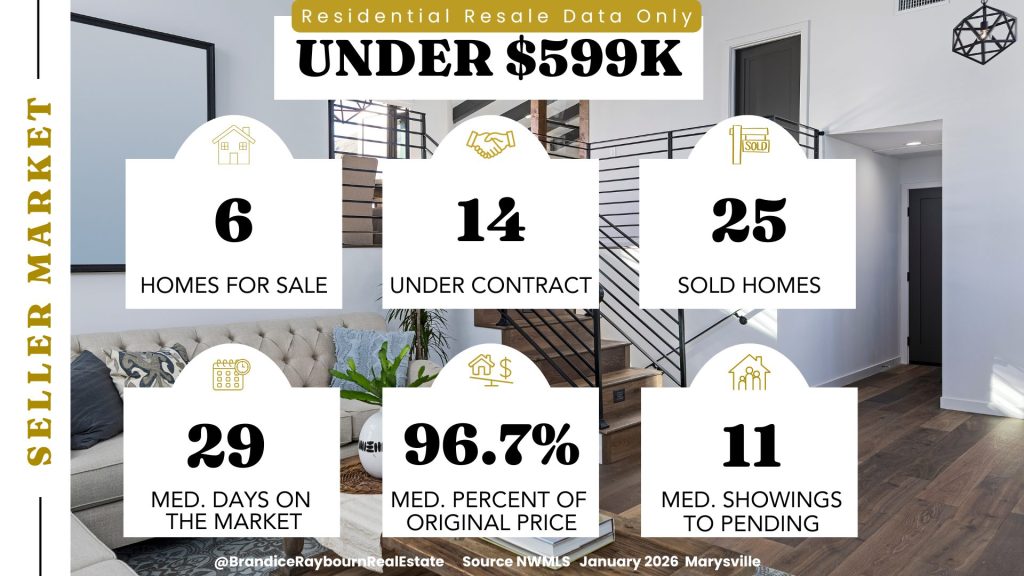
Under $649K
This range was expanded to $649K due to extremely limited resale inventory below this level. Snohomish is slowly becoming a market where first-time buyers need a stronger budget to enter, and resale options remain scarce.
This continues to be one of the tightest price ranges in Snohomish. Demand still exists, but winter conditions are slowing buyer decision-making. Homes are no longer flying off the market in days, even at the entry level.
Sellers still hold an advantage here, though patience is required.
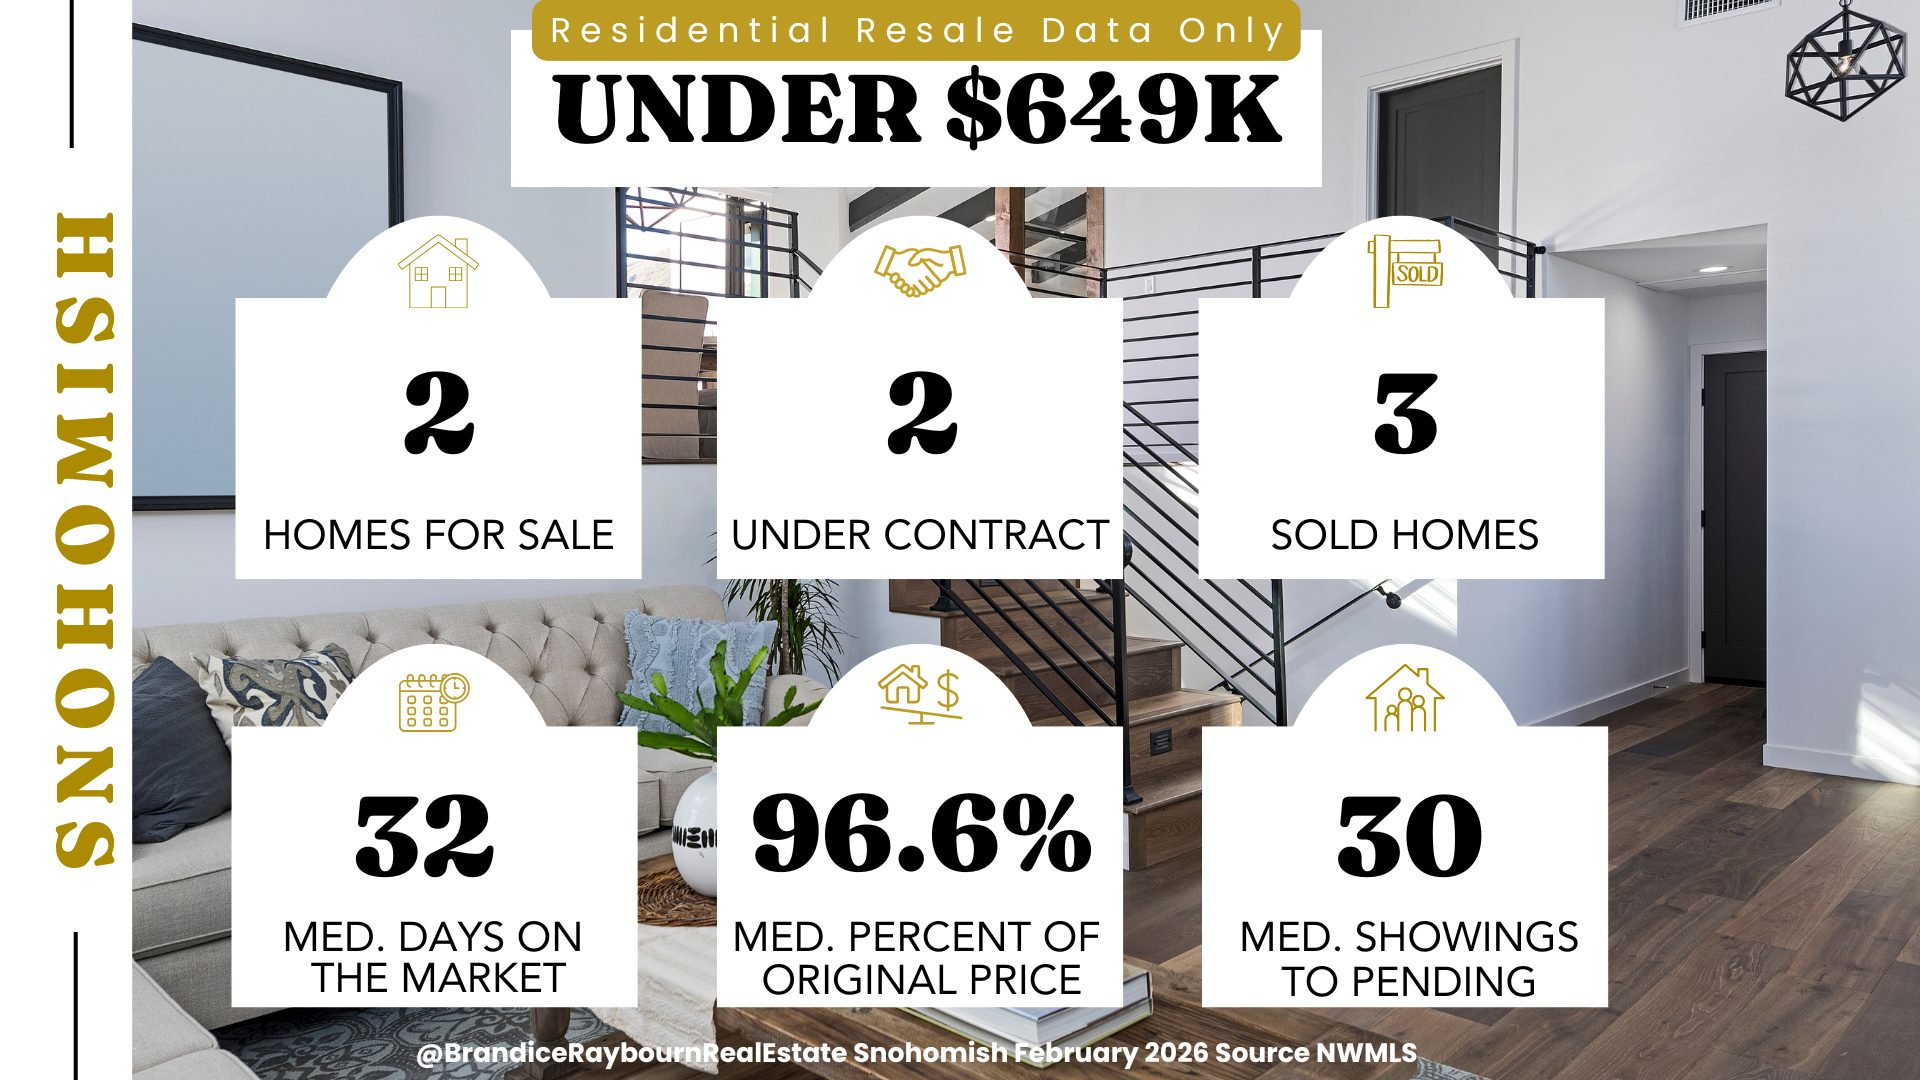
Source: NWMLS | Analysis by Brandice Raybourn
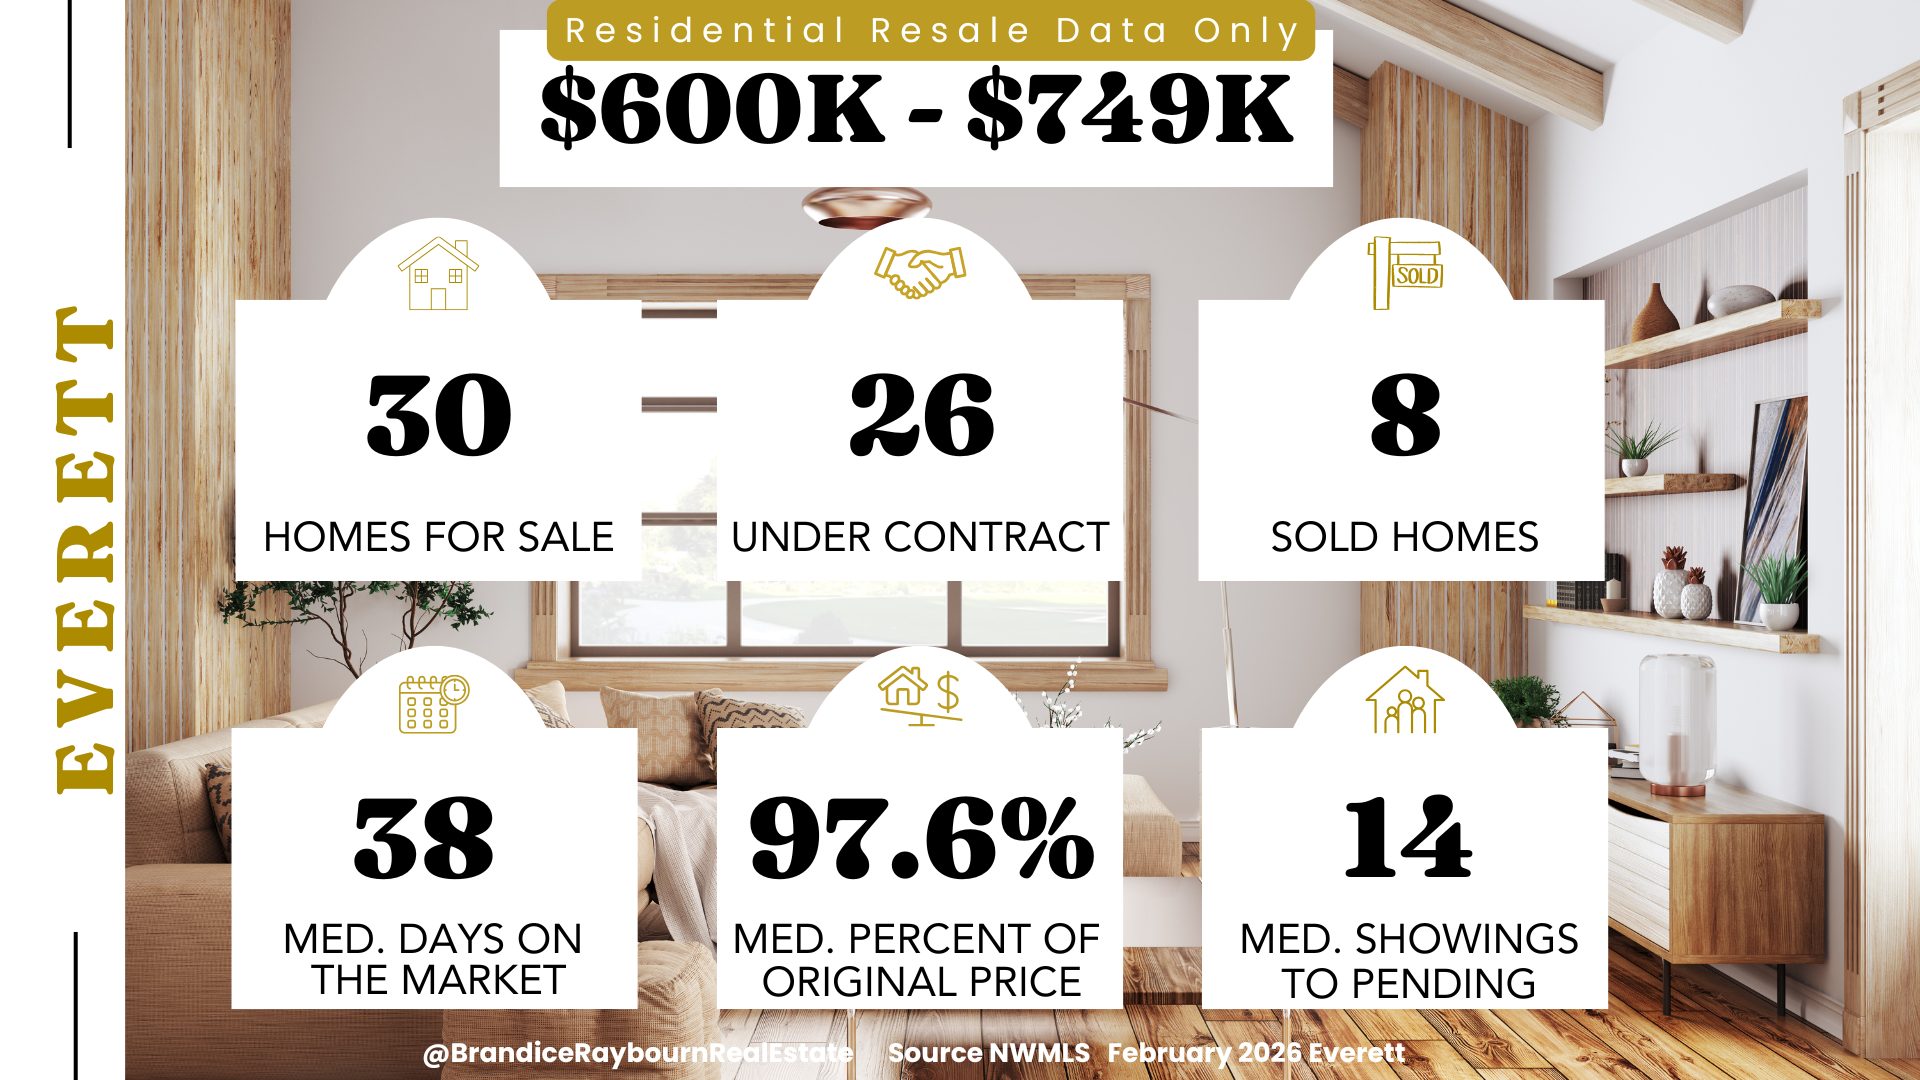
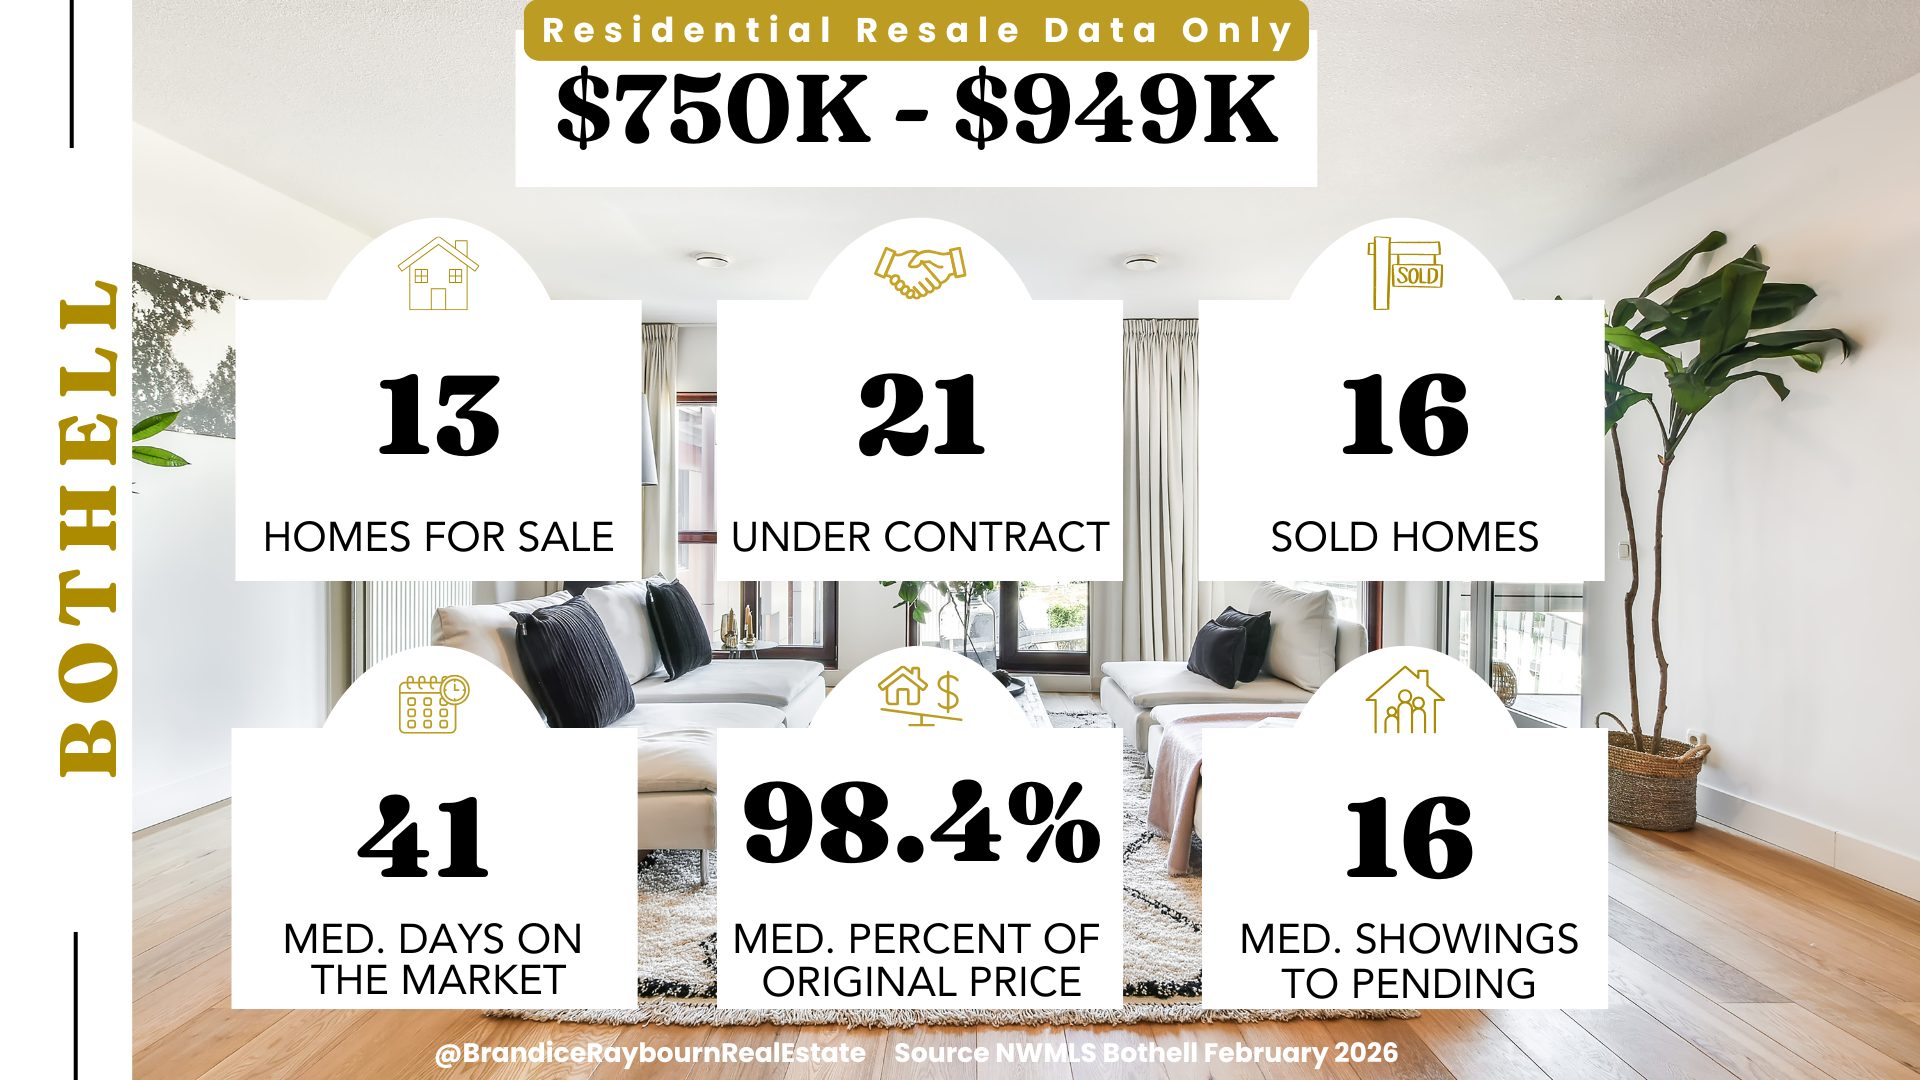
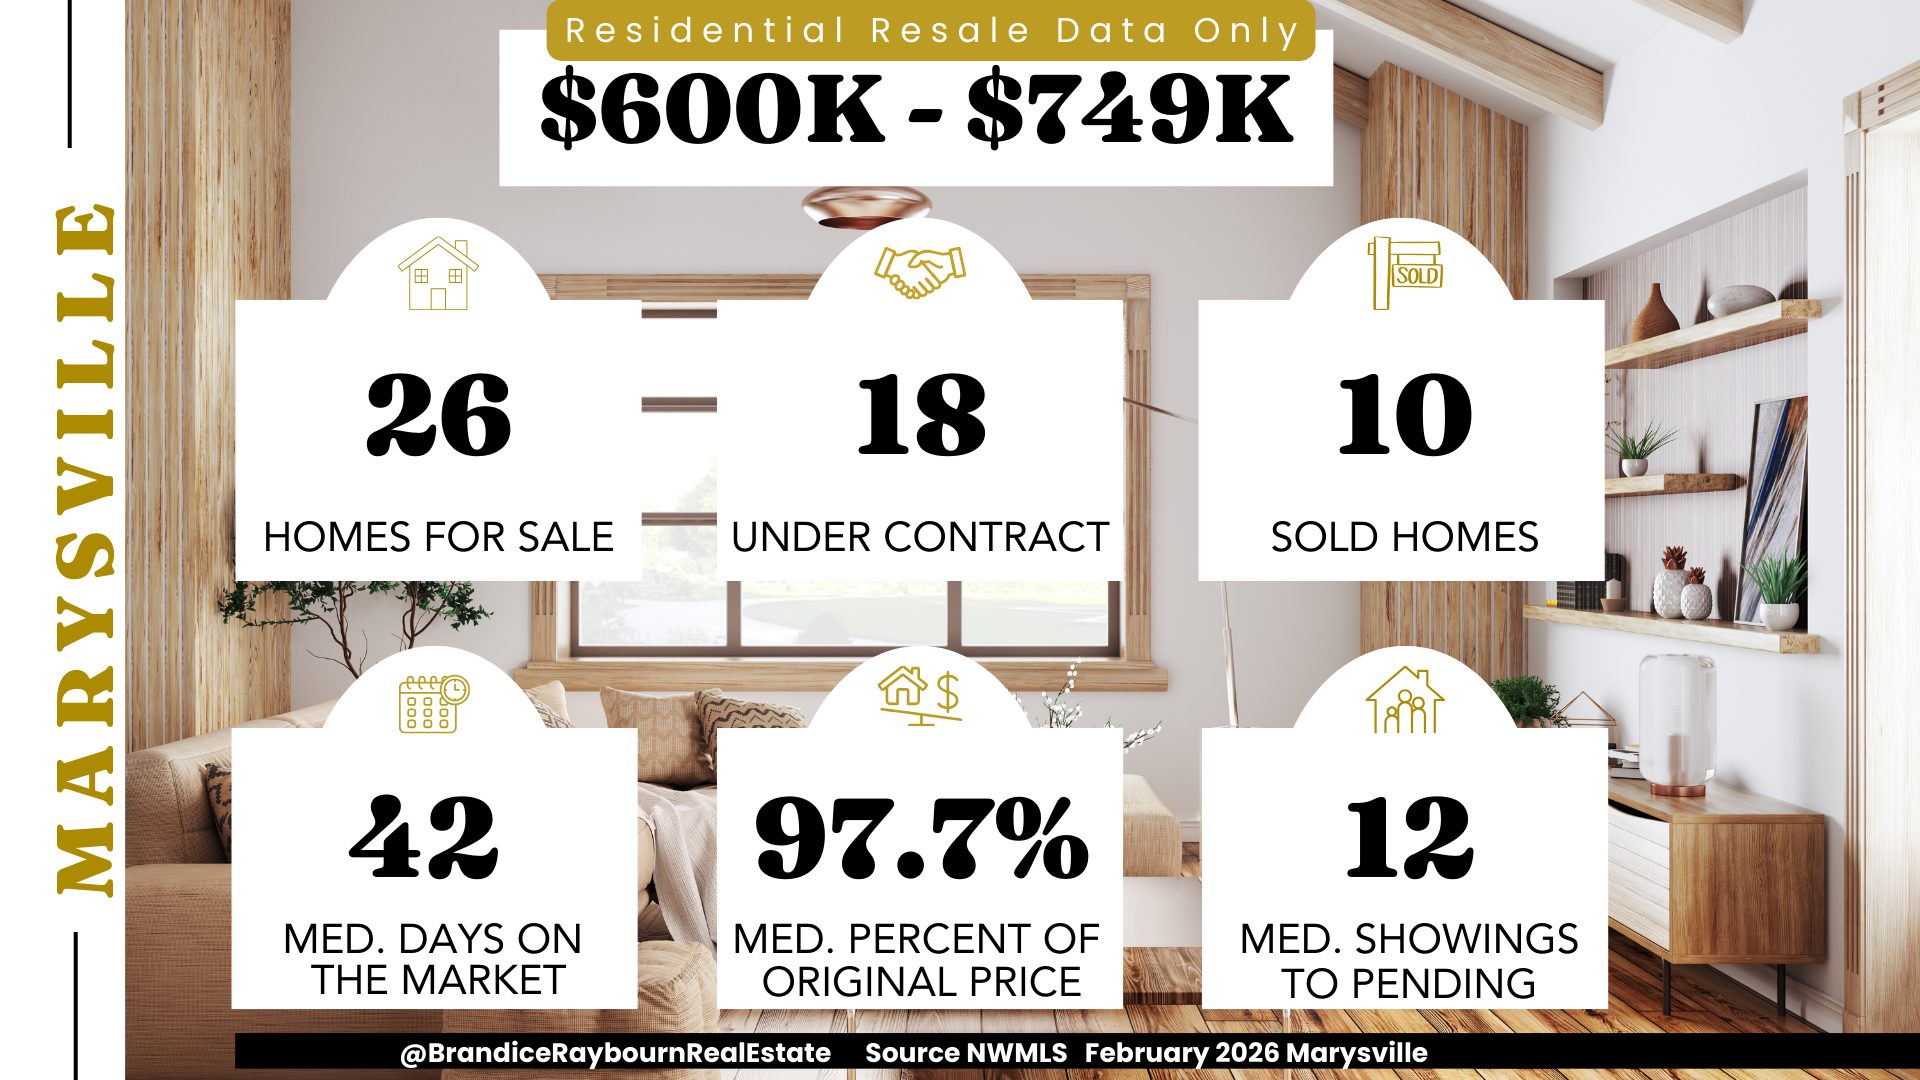
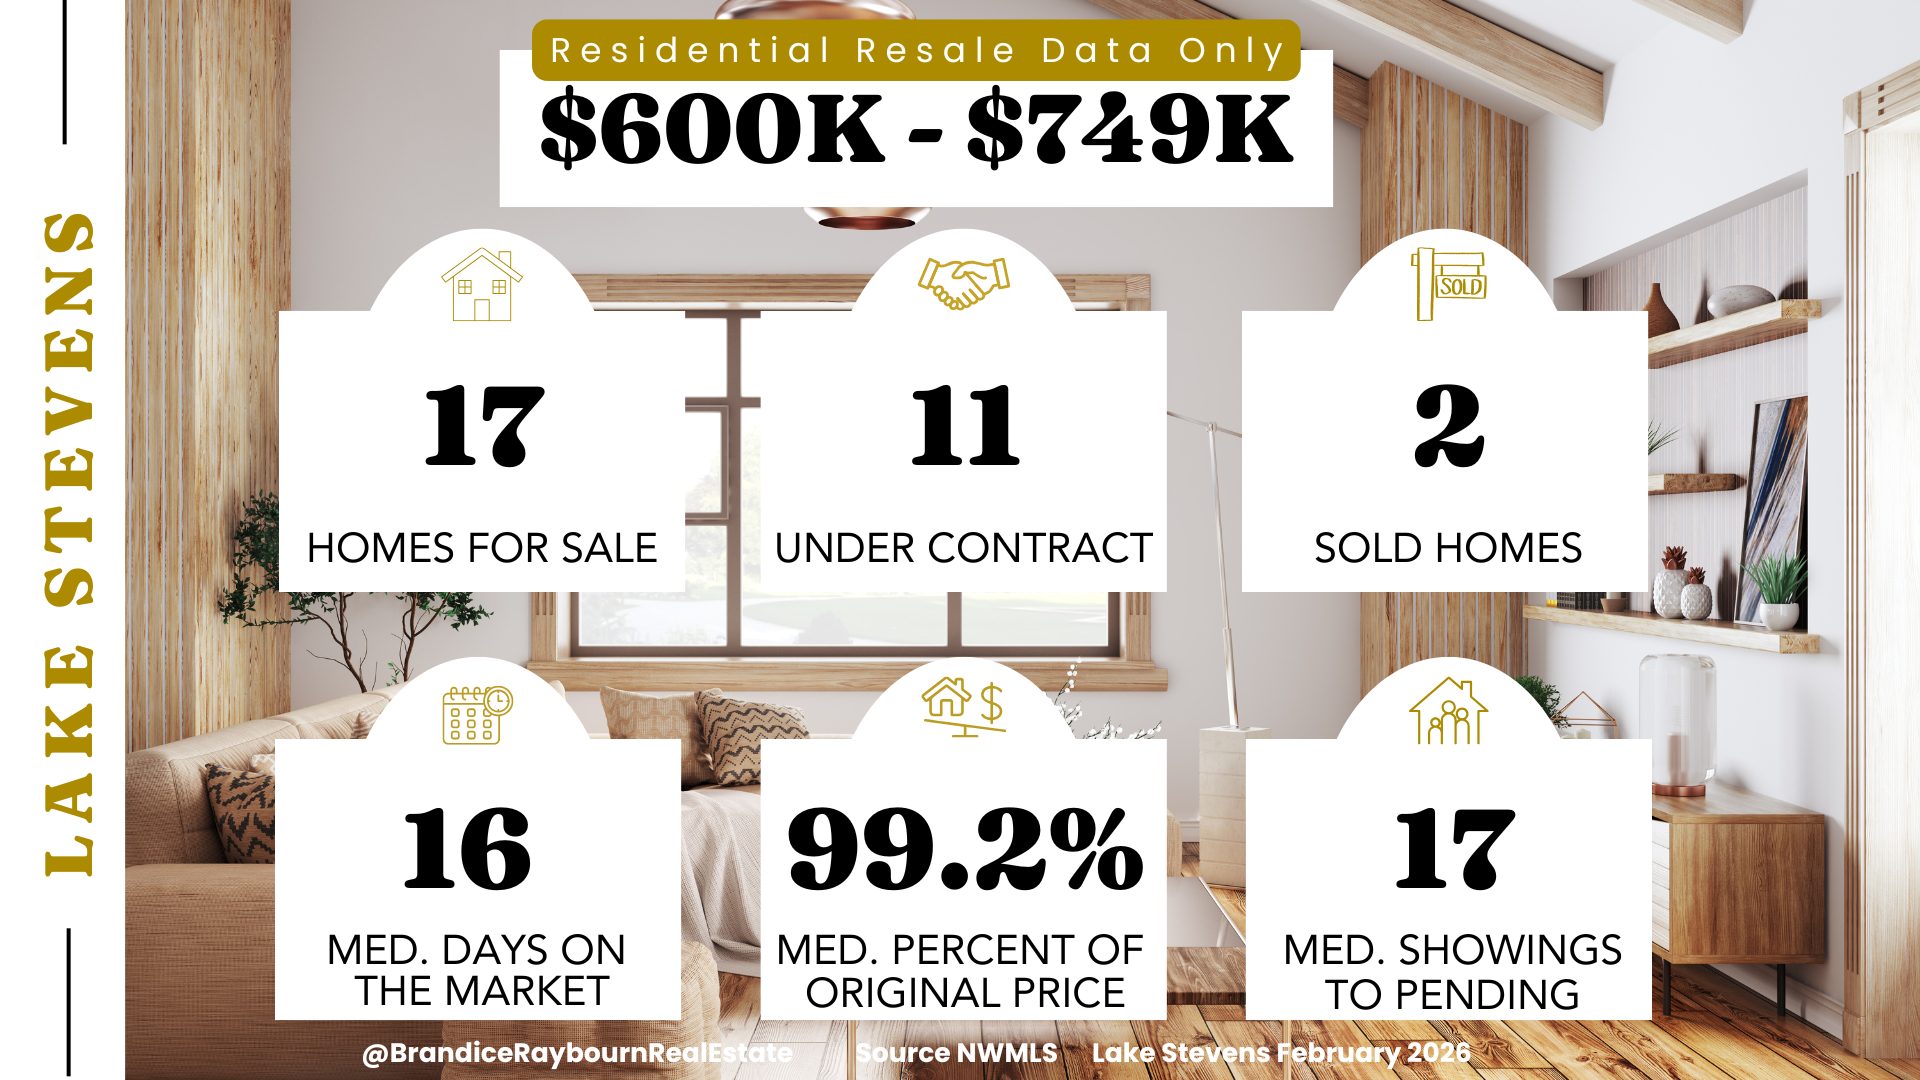
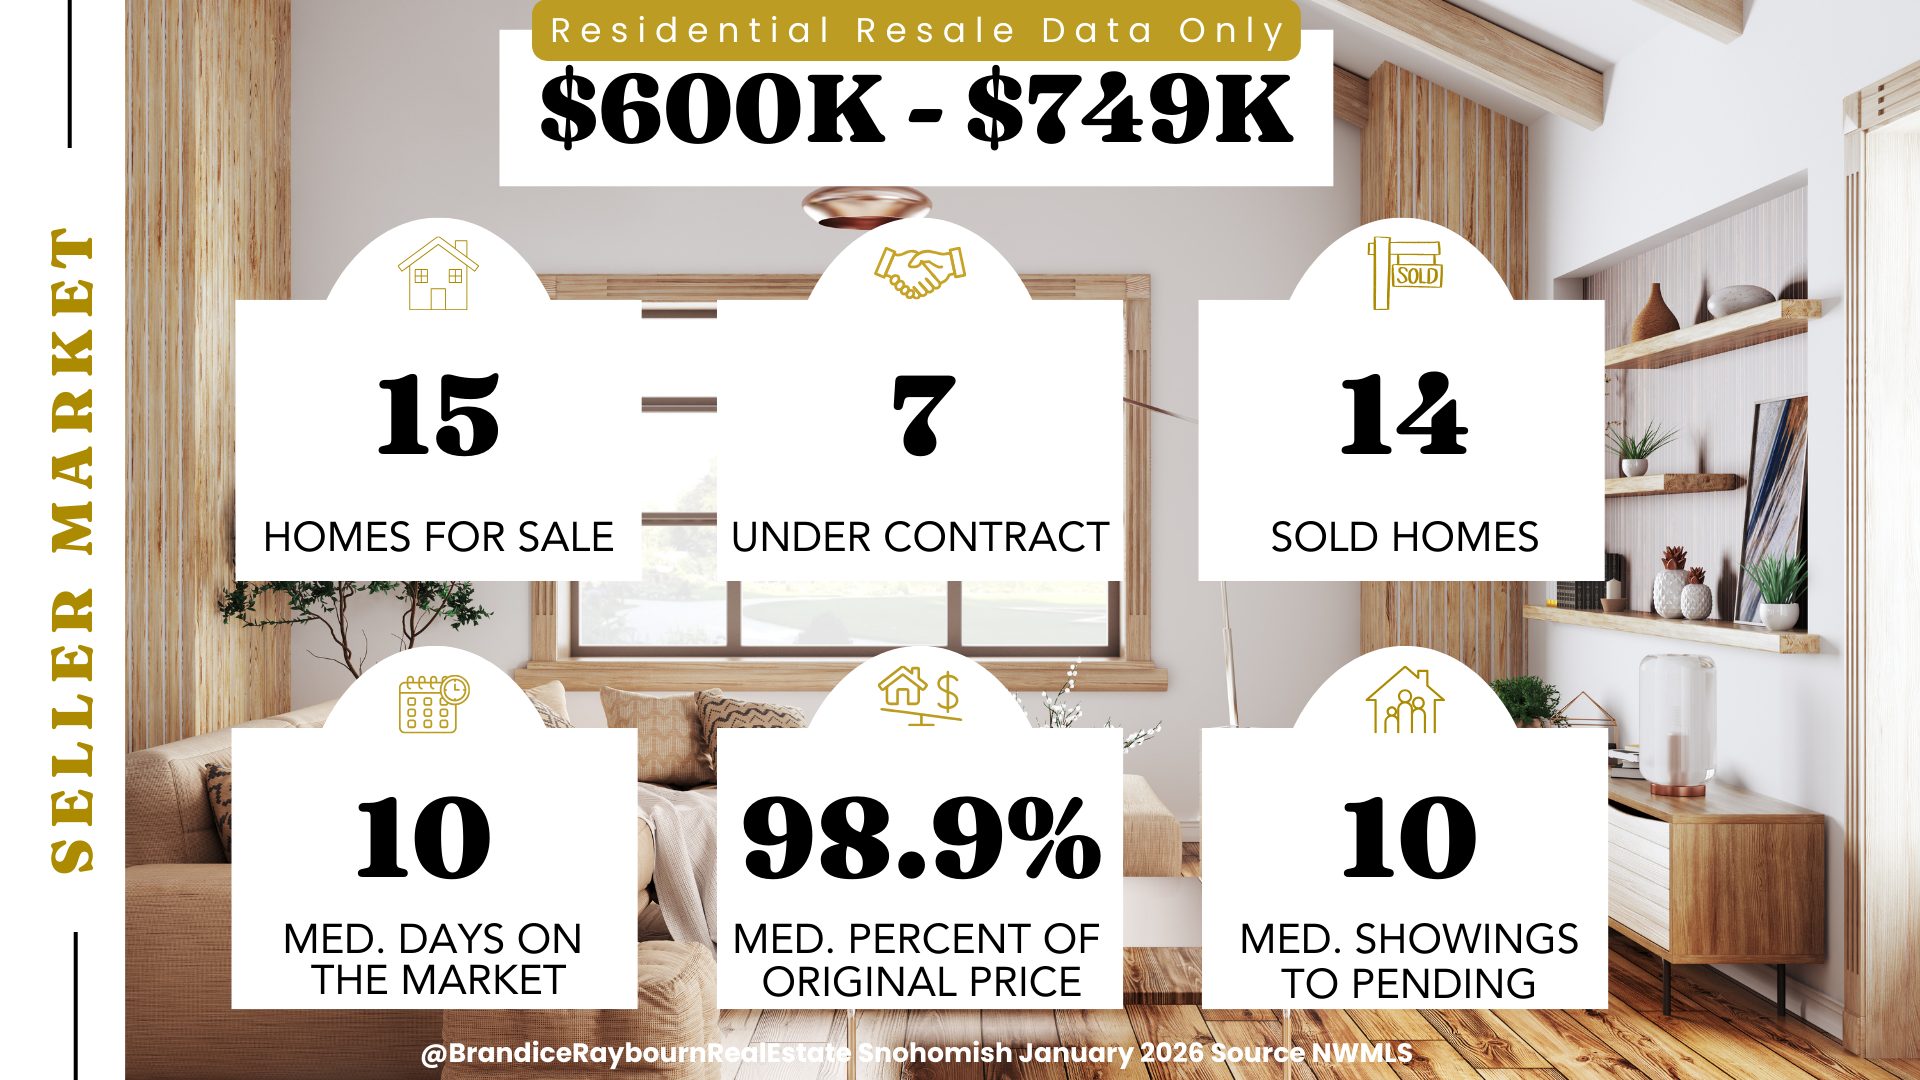
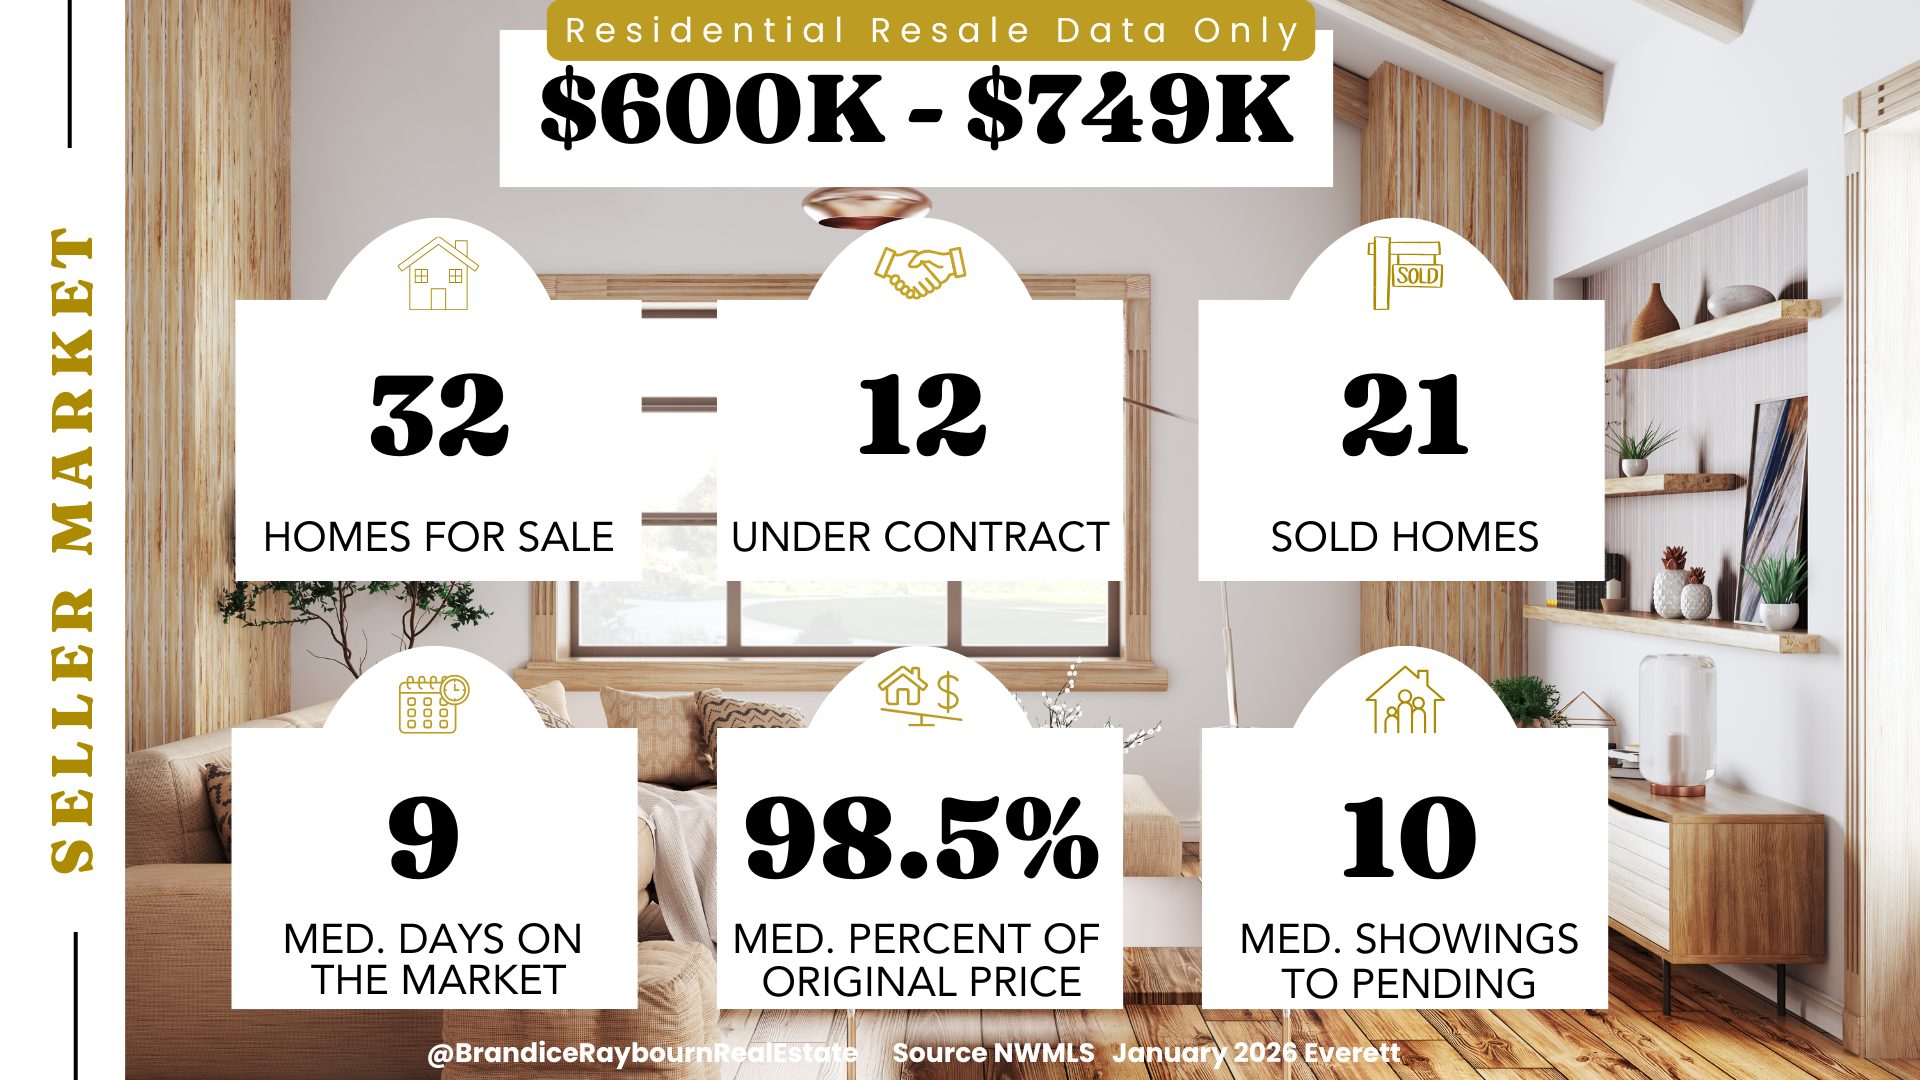
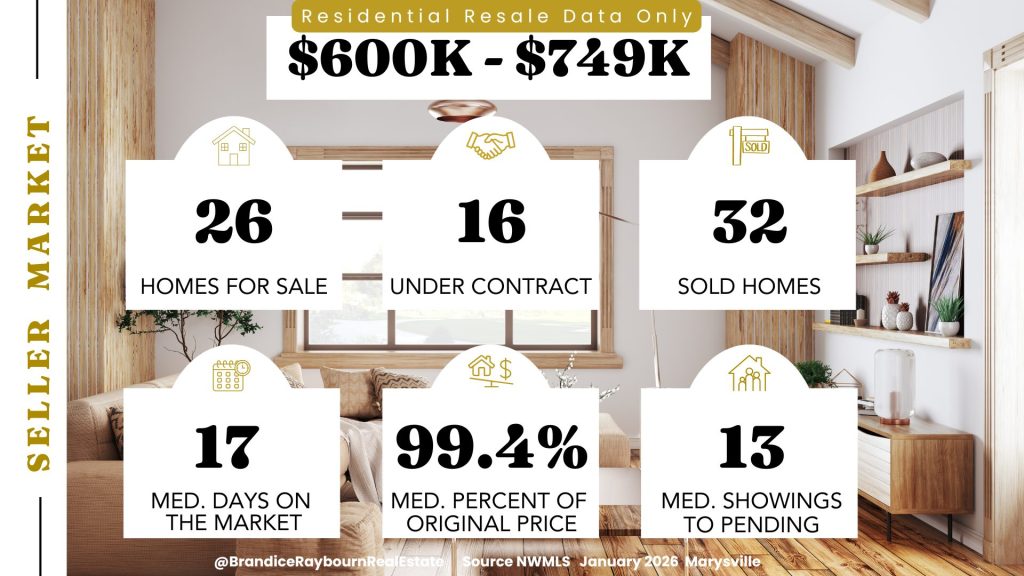
$650K – $849K
This price range is feeling the slowdown more clearly. Buyer activity and available inventory are closely matched, and homes are spending more time on the market. Some of the longer timelines reflect homes that sold last month after sitting for extended periods, which has pushed averages higher.
Presentation and pricing play a major role in how quickly a home moves. Homes priced competitively are still selling, while others are sitting as buyers take their time.

Source: NWMLS | Analysis by Brandice Raybourn
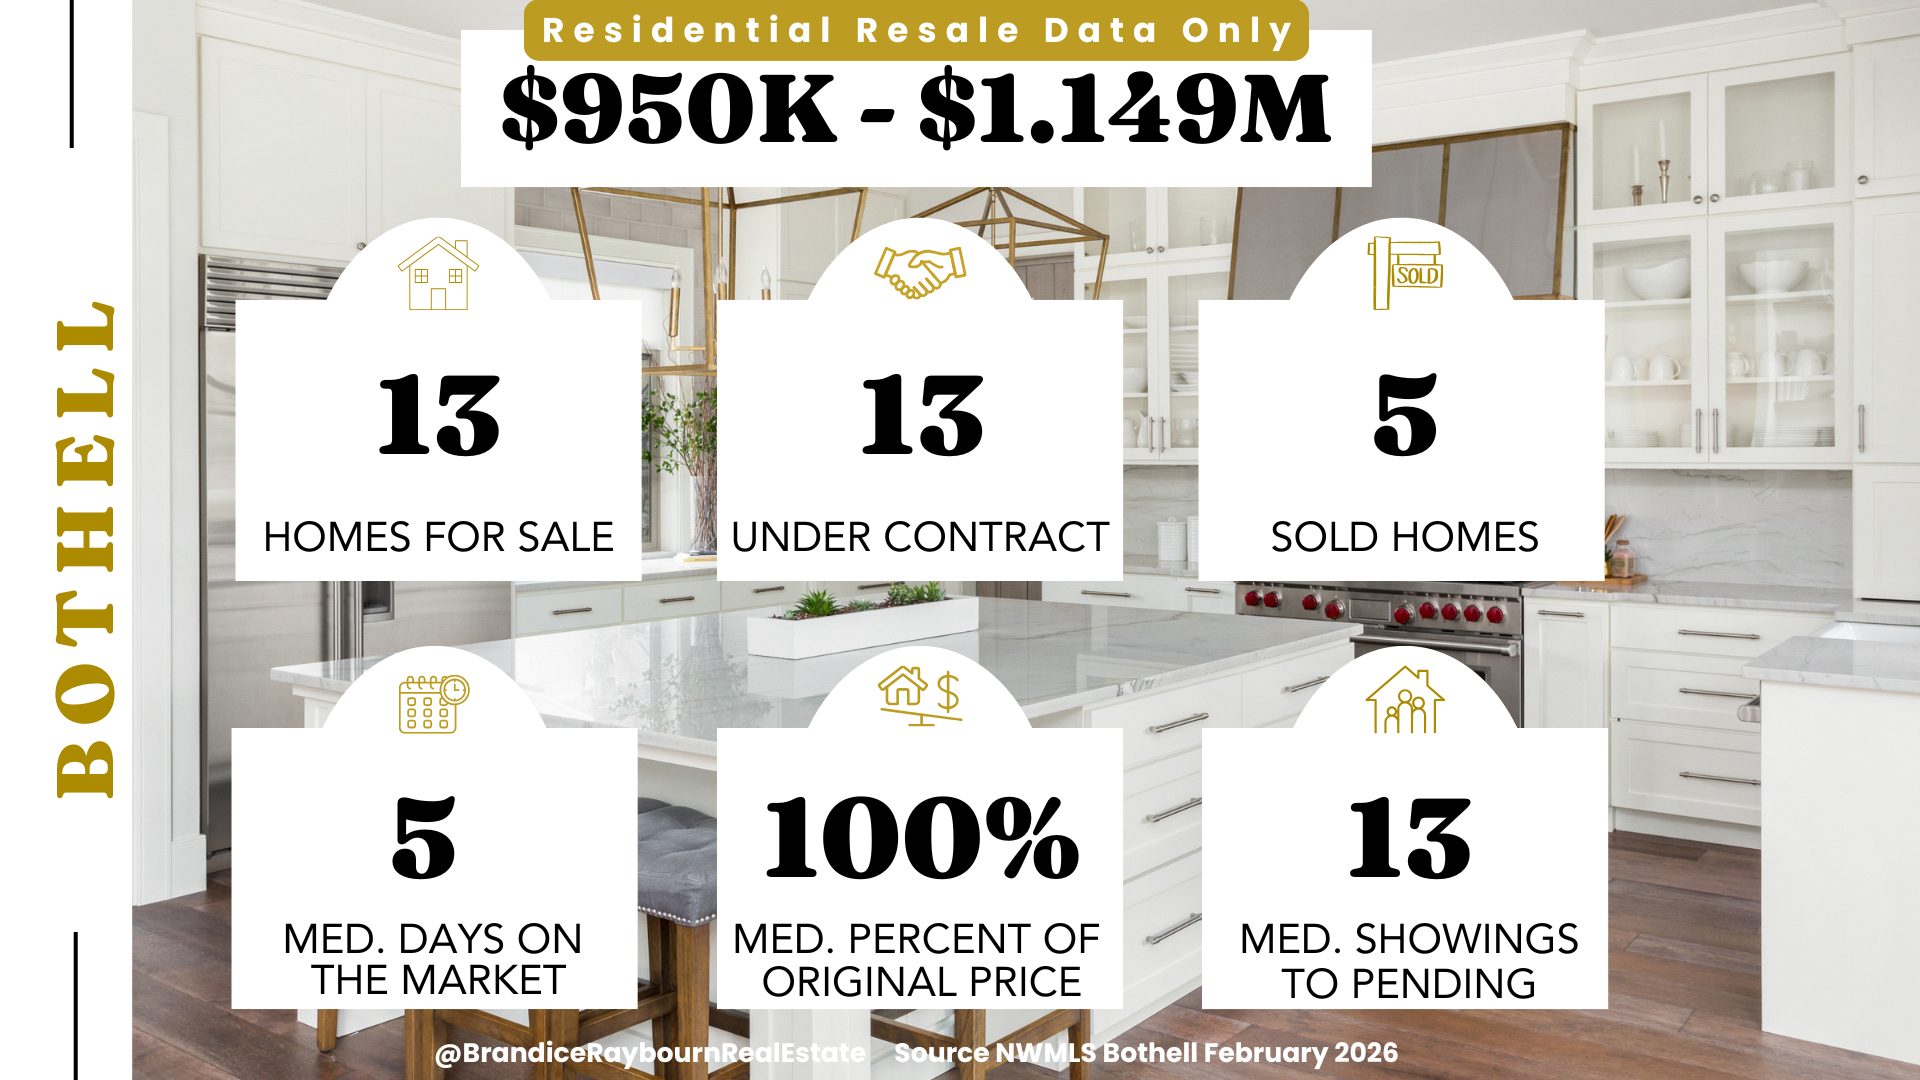
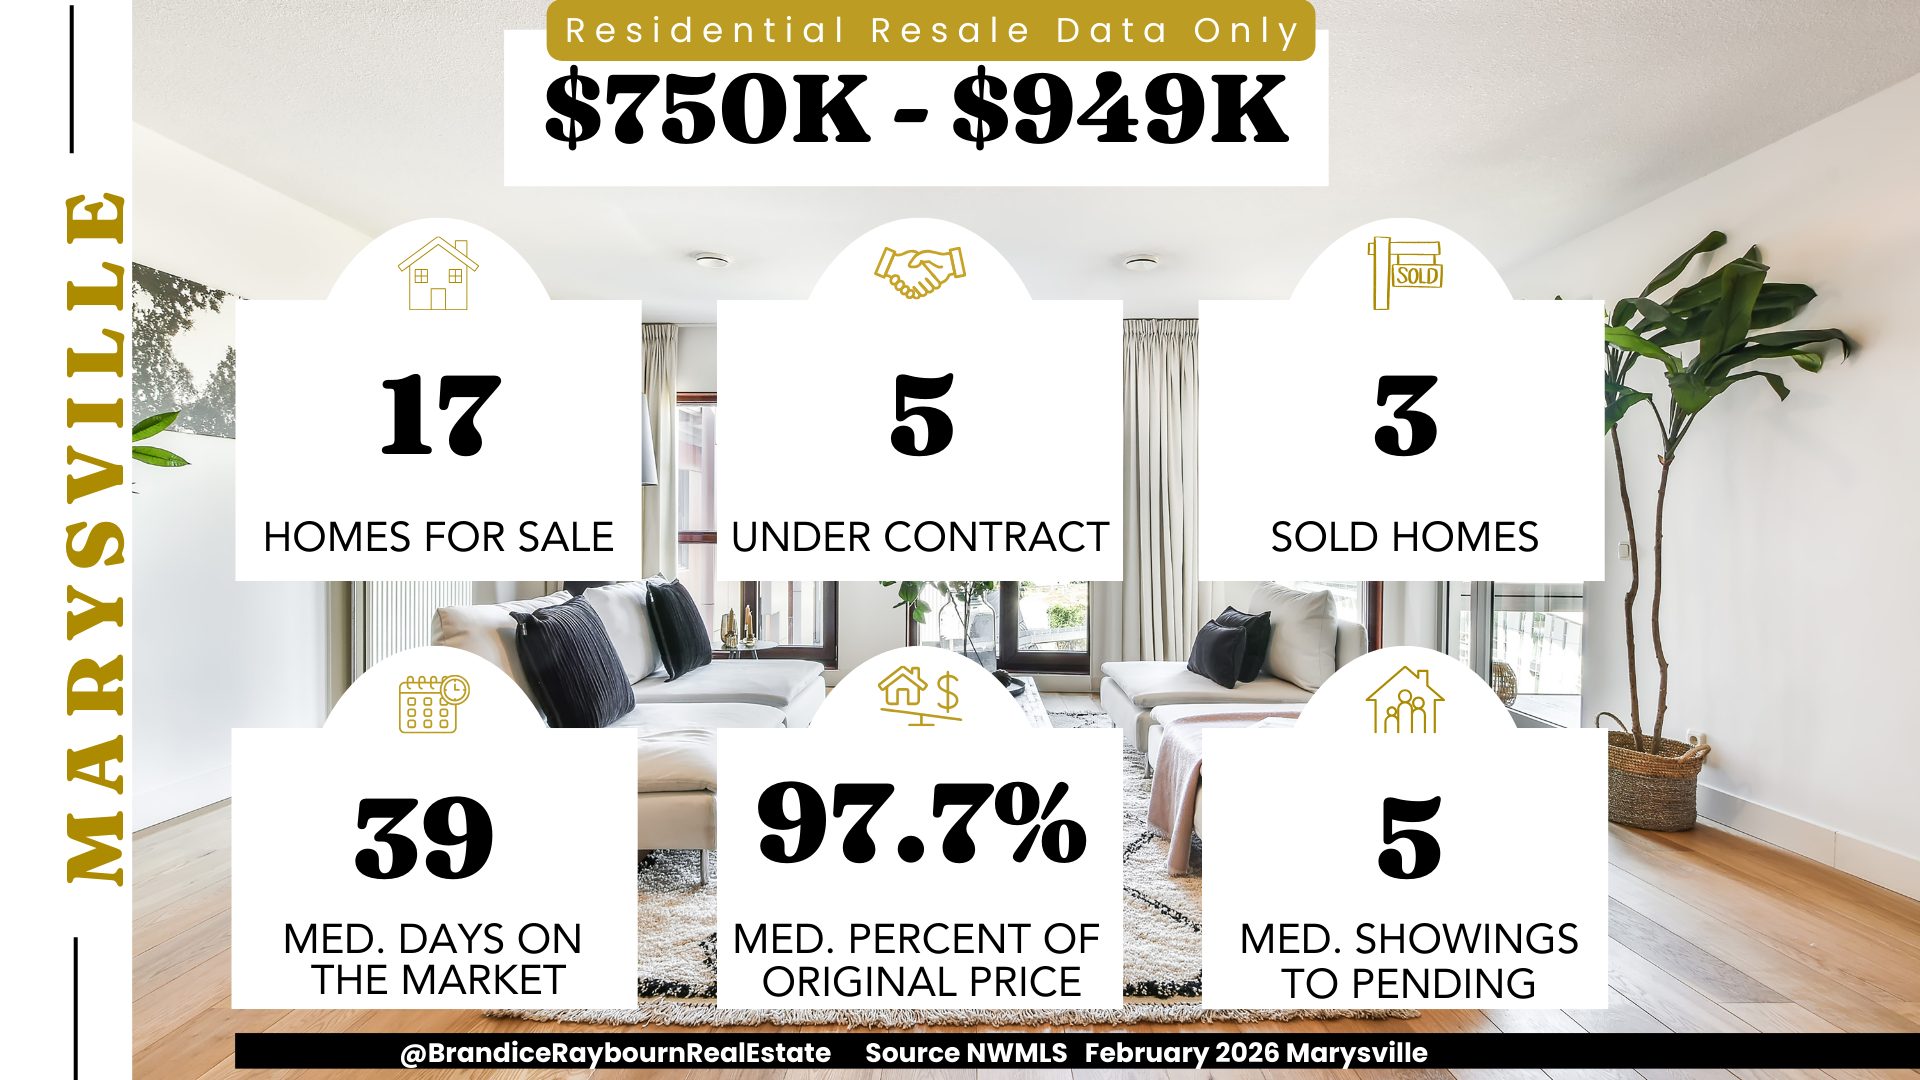
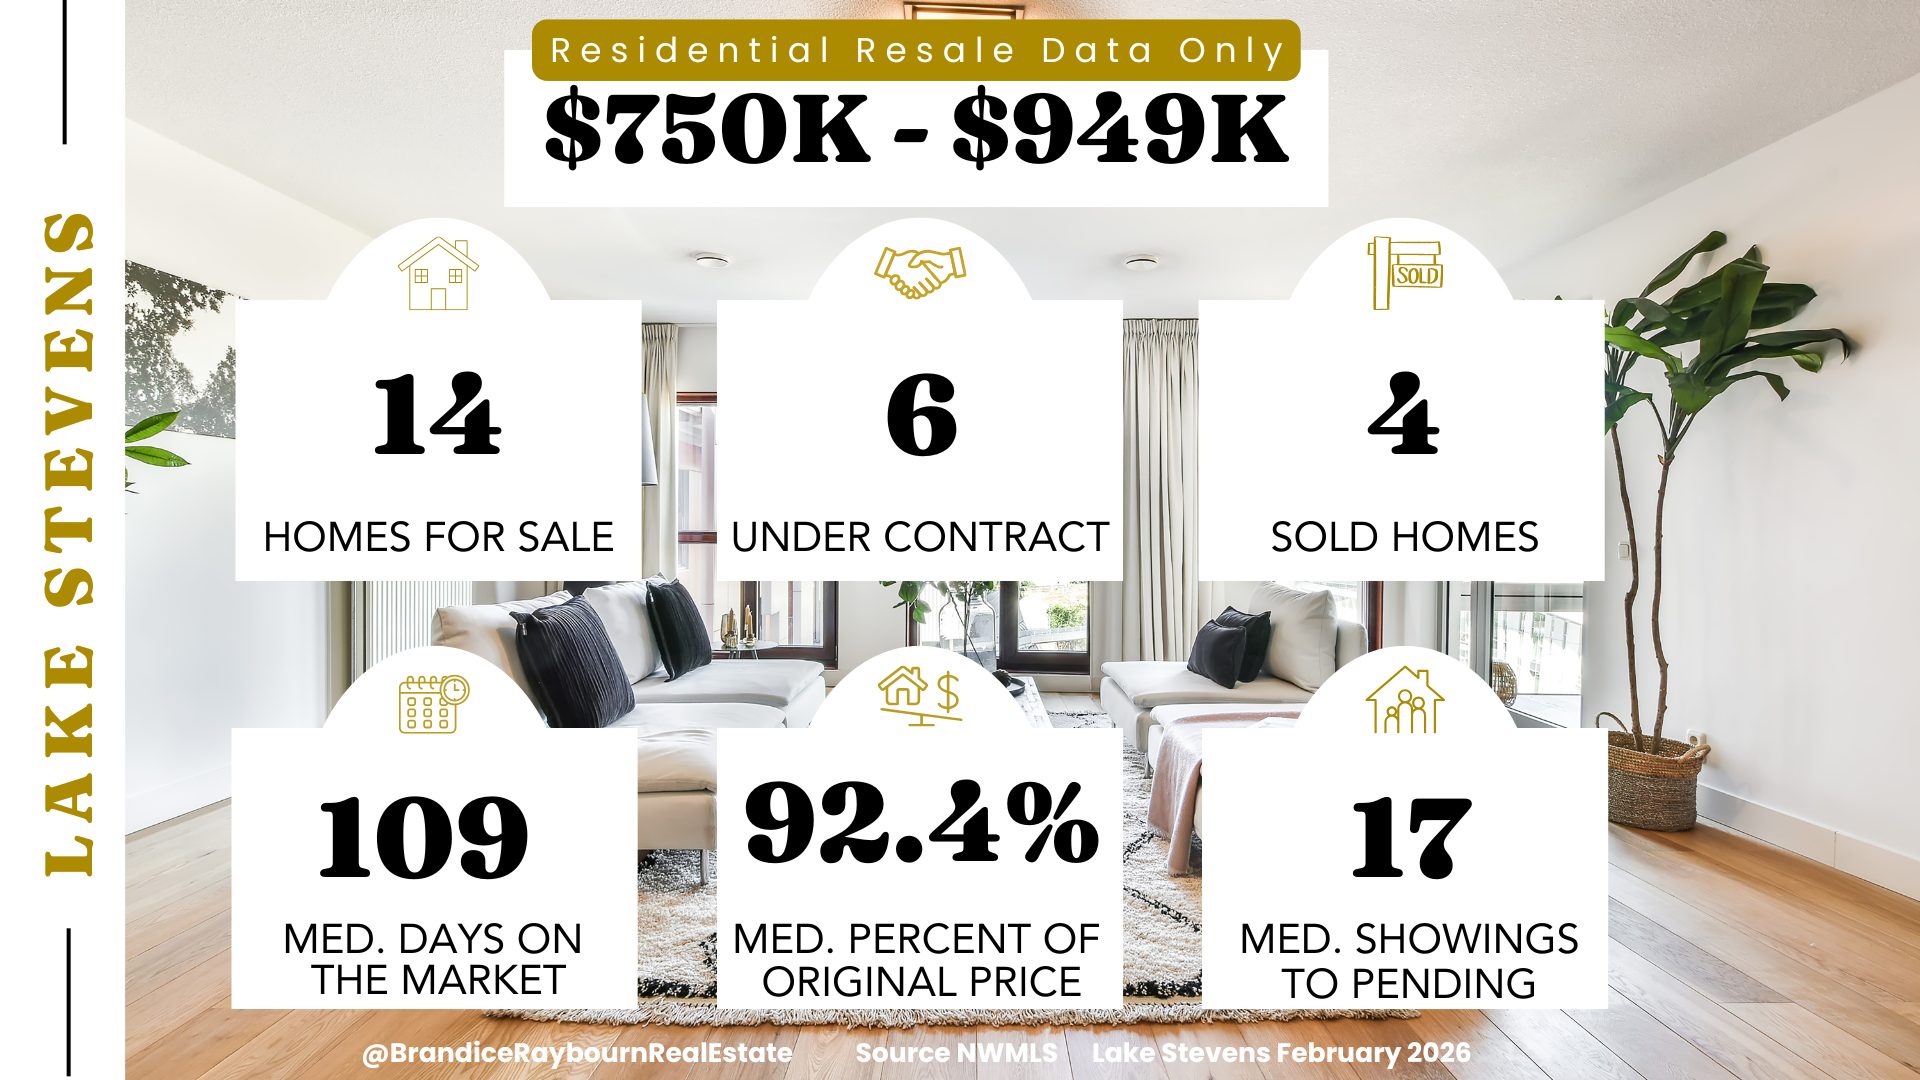
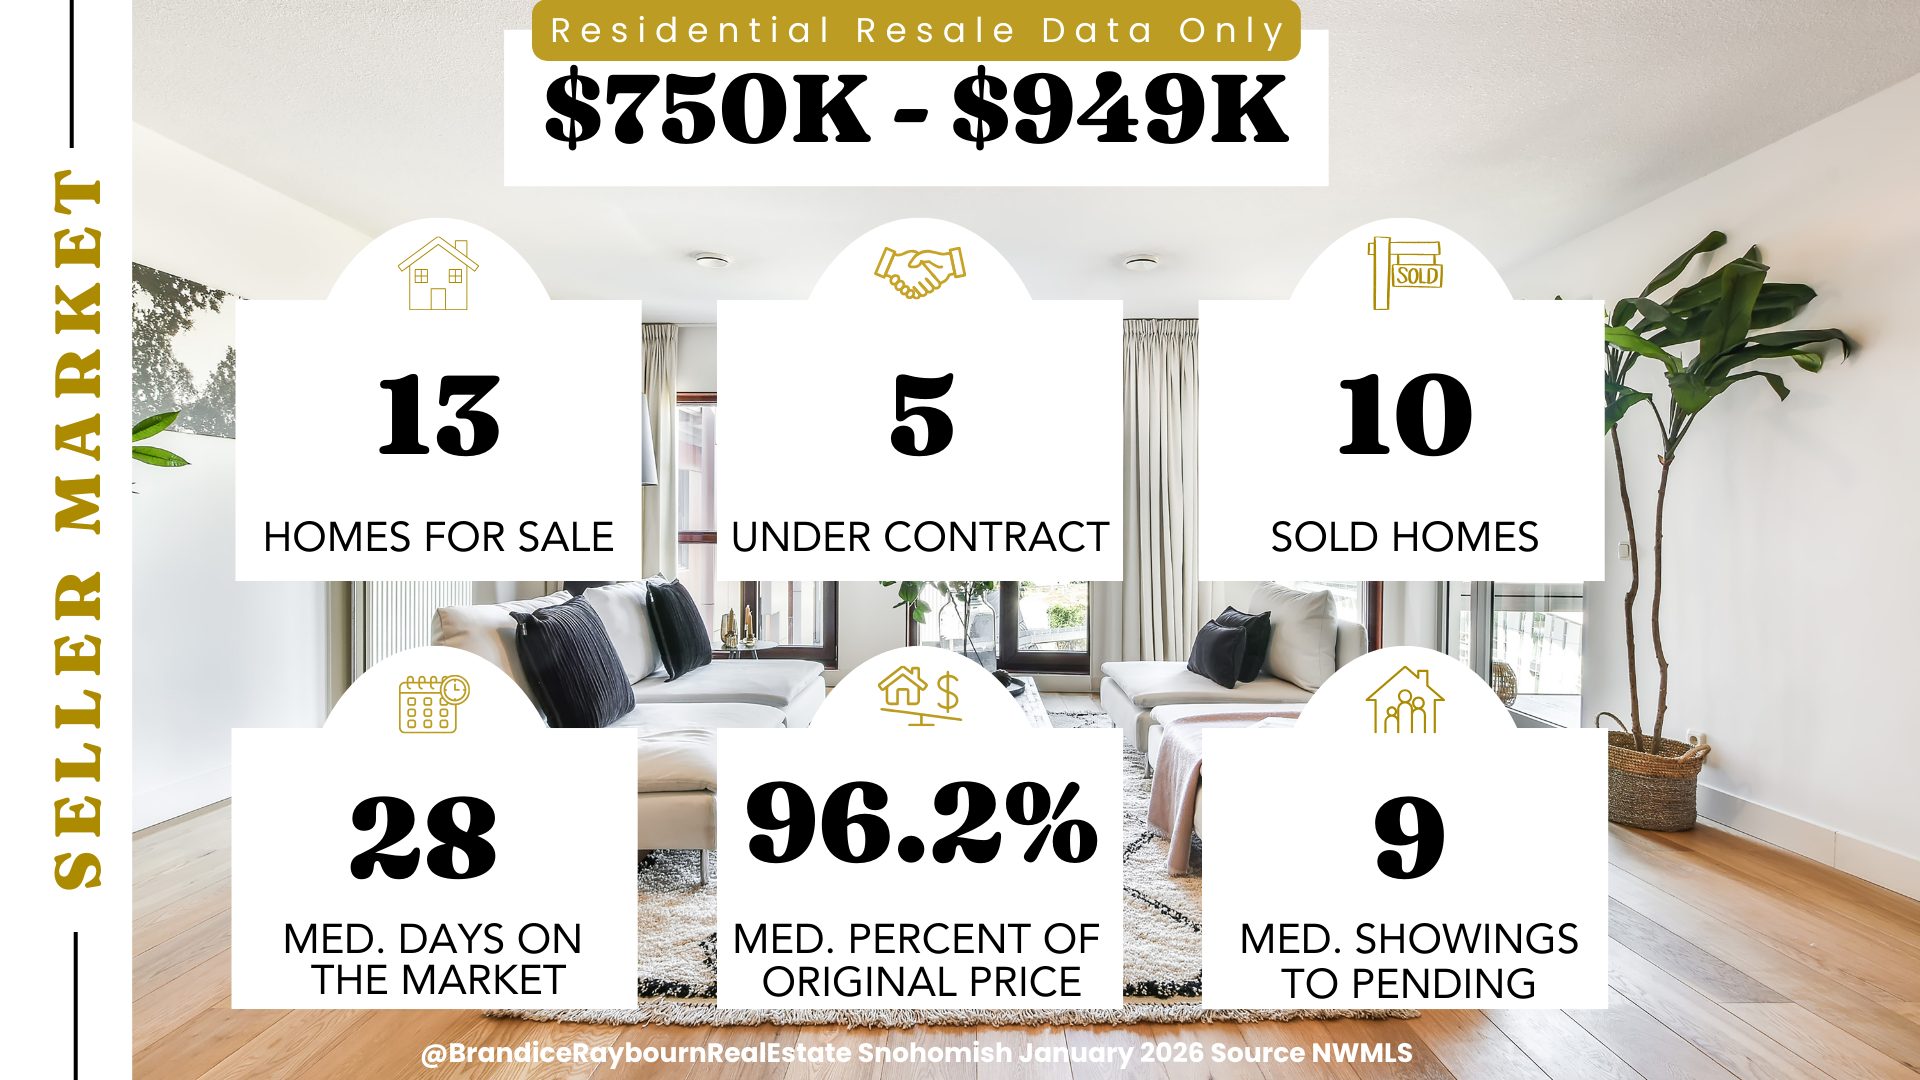
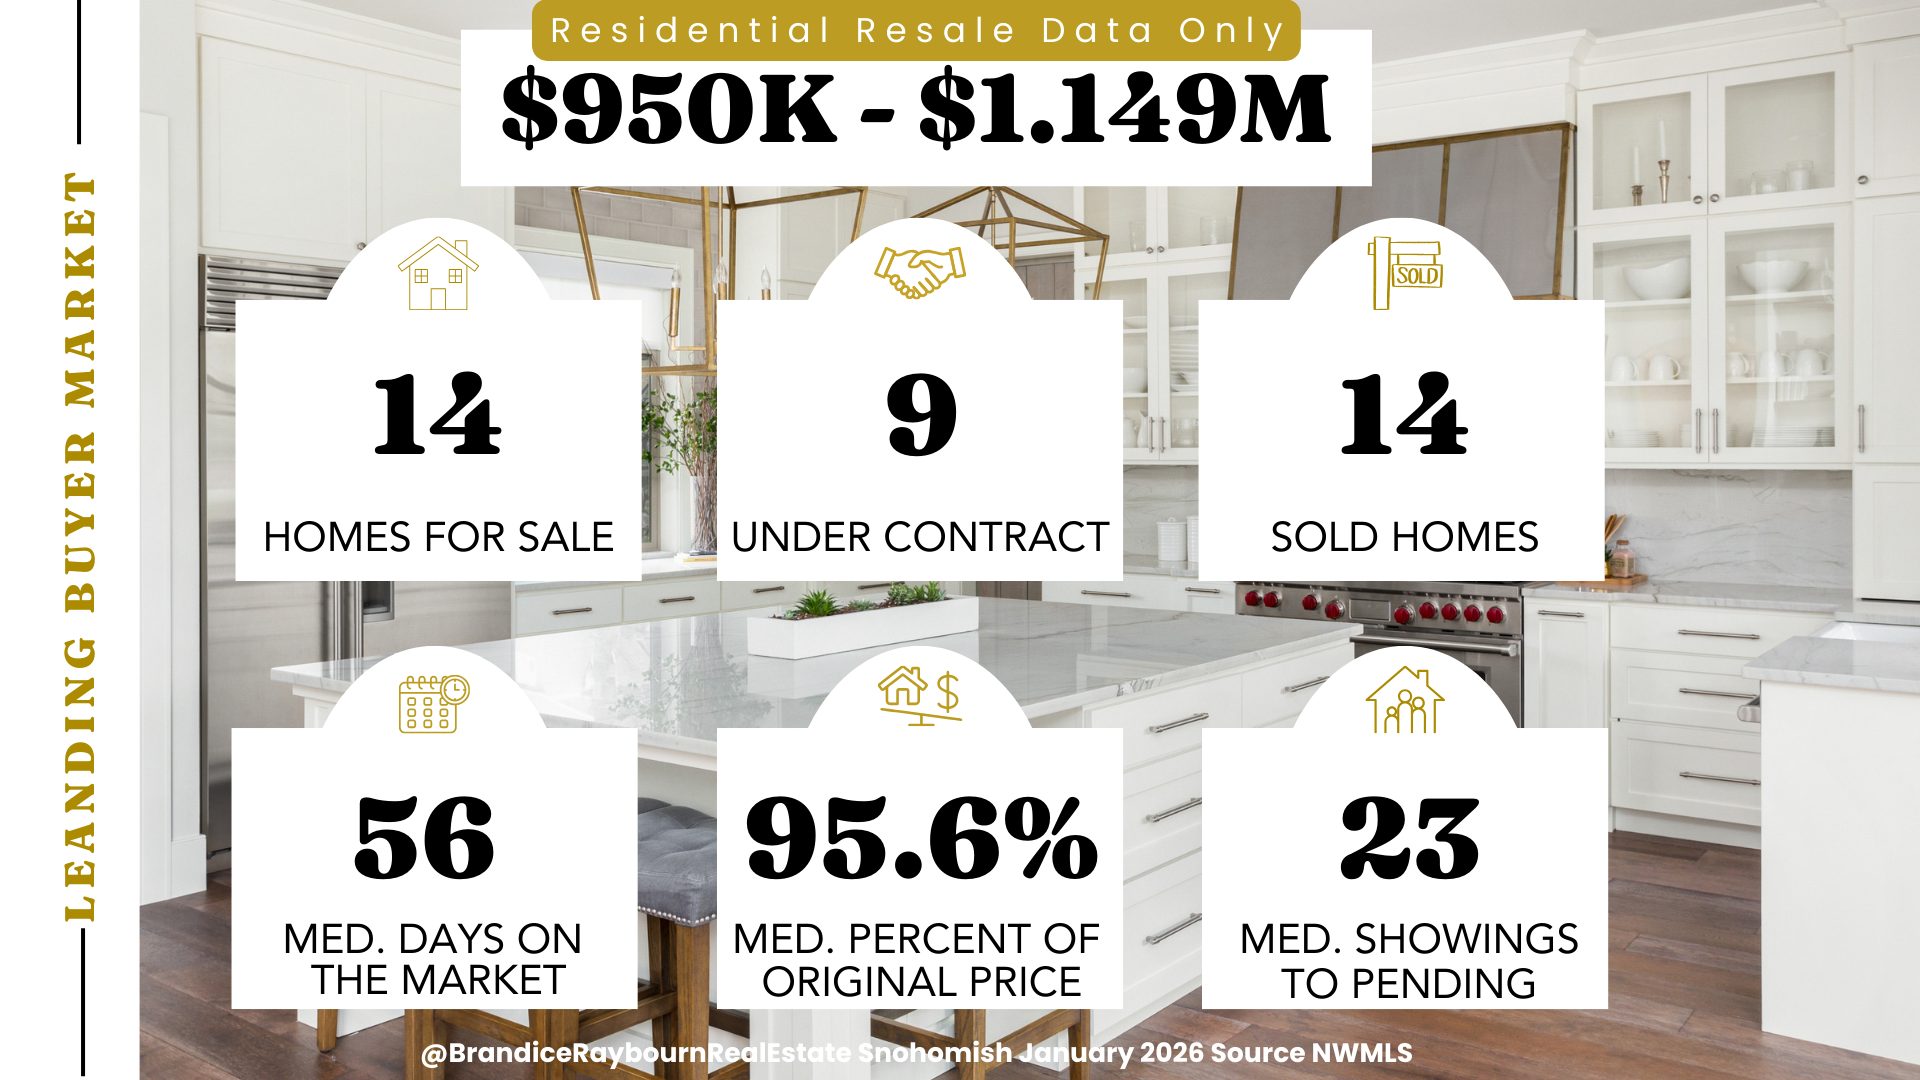
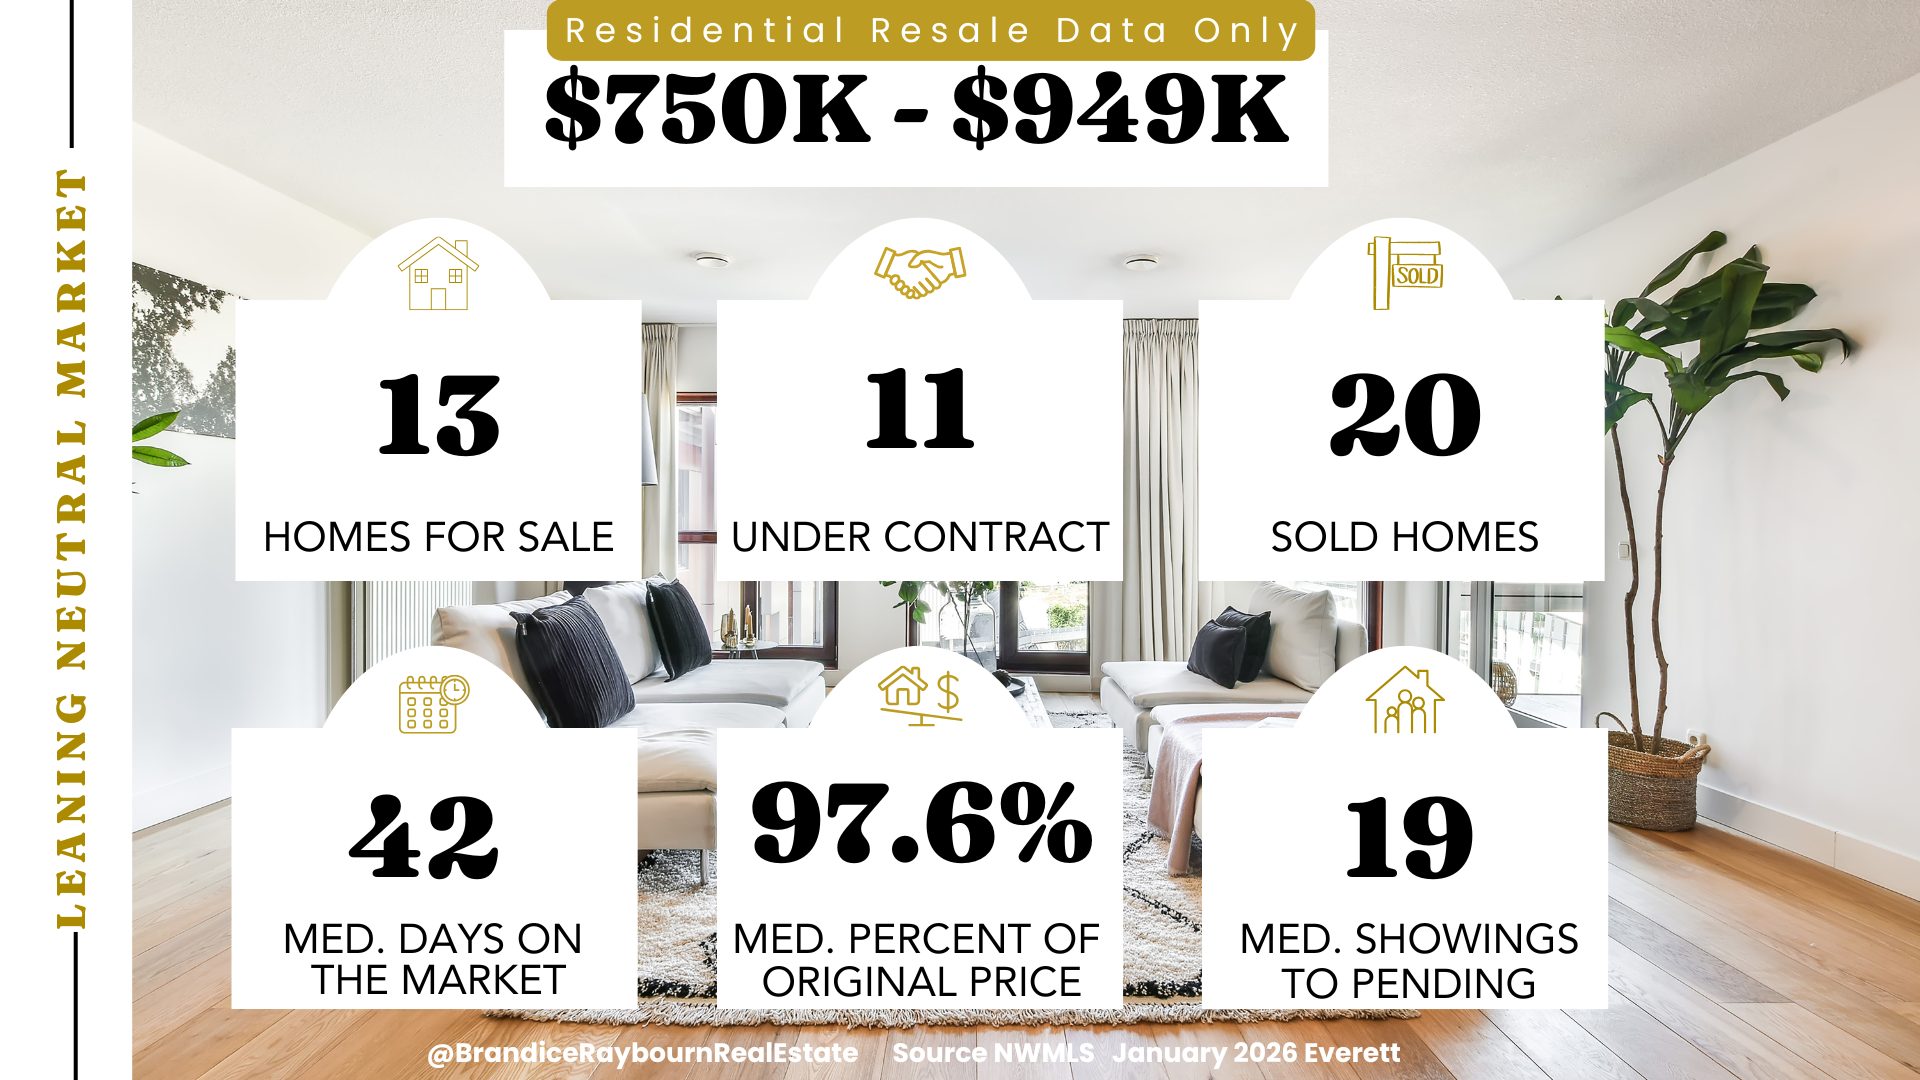
$850K – $1.049M
This is where the market noticeably shifts. Buyers have options and are more deliberate, with many homes seeing significant buyer traffic before going under contract. Longer days on market are common, and sellers should expect fewer impulsive offers.
This range requires realistic pricing and a clear understanding of the competition.
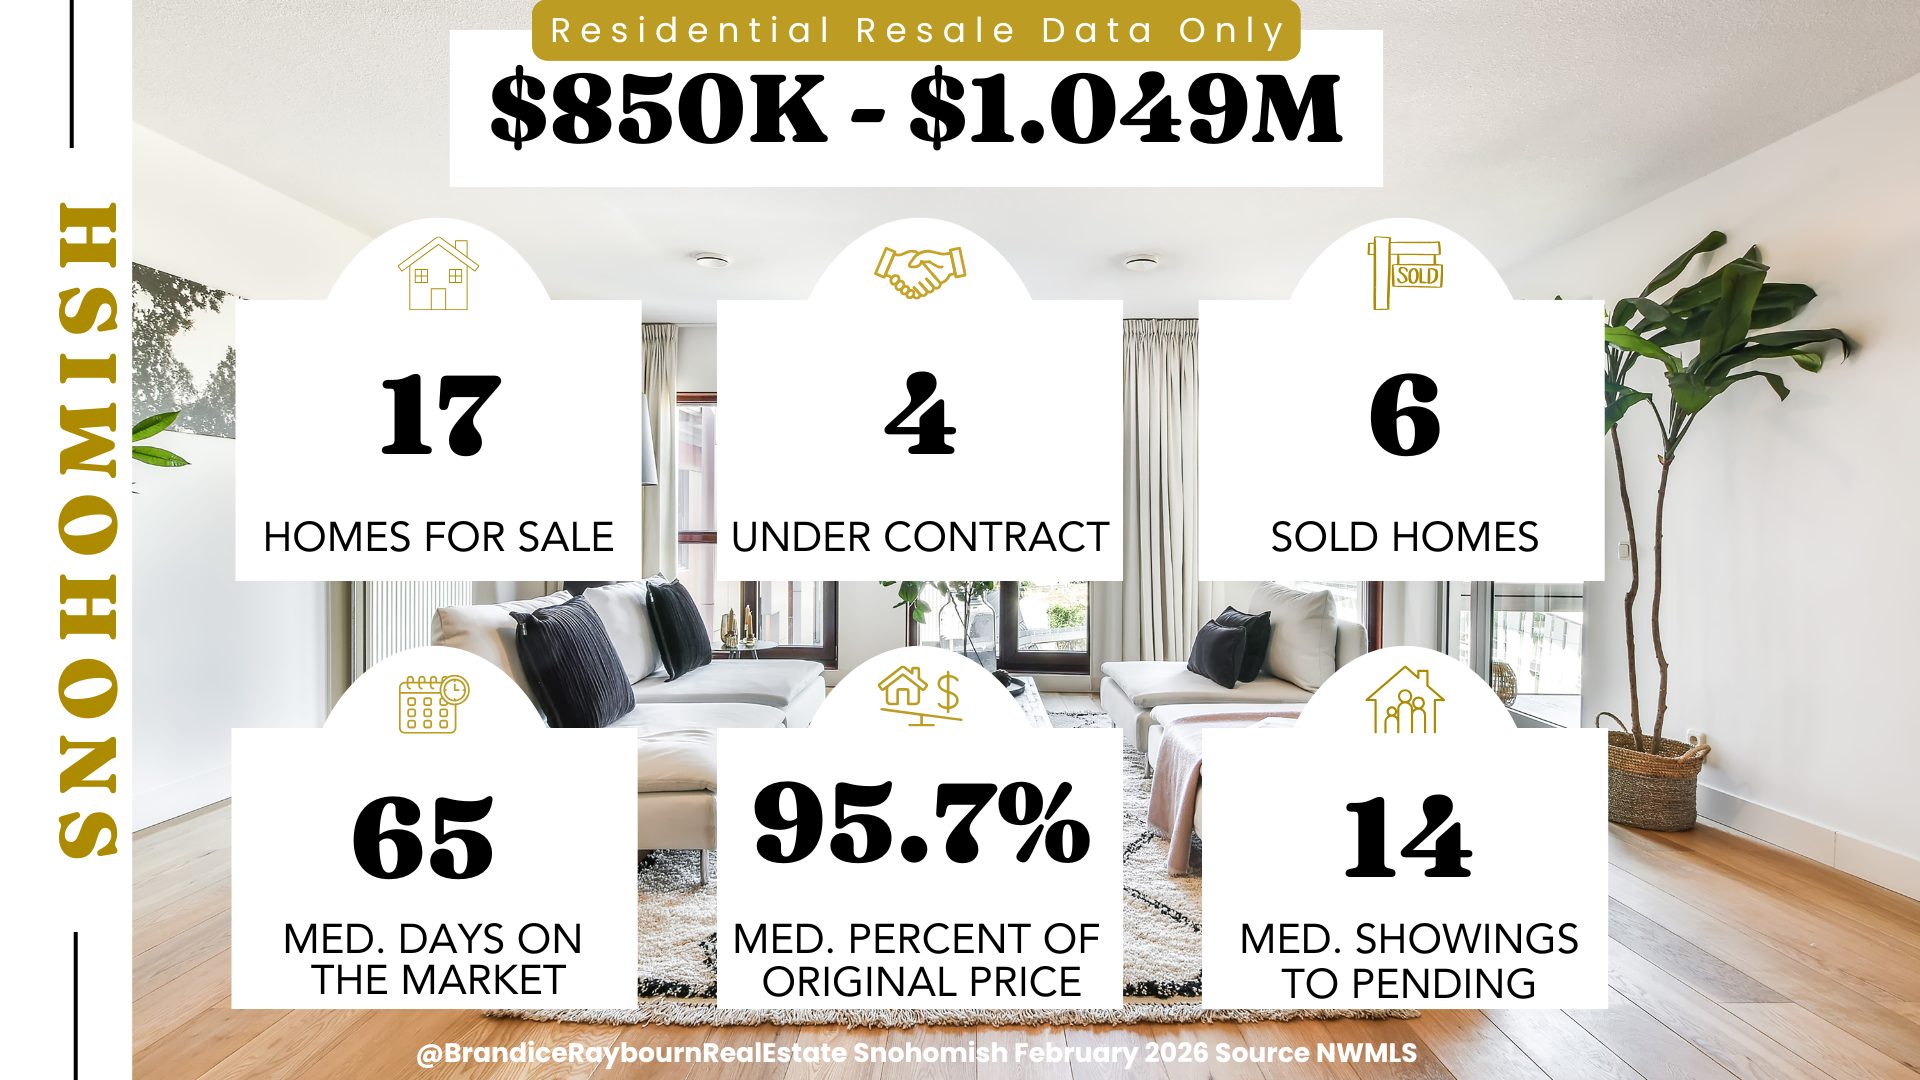
Source: NWMLS | Analysis by Brandice Raybourn
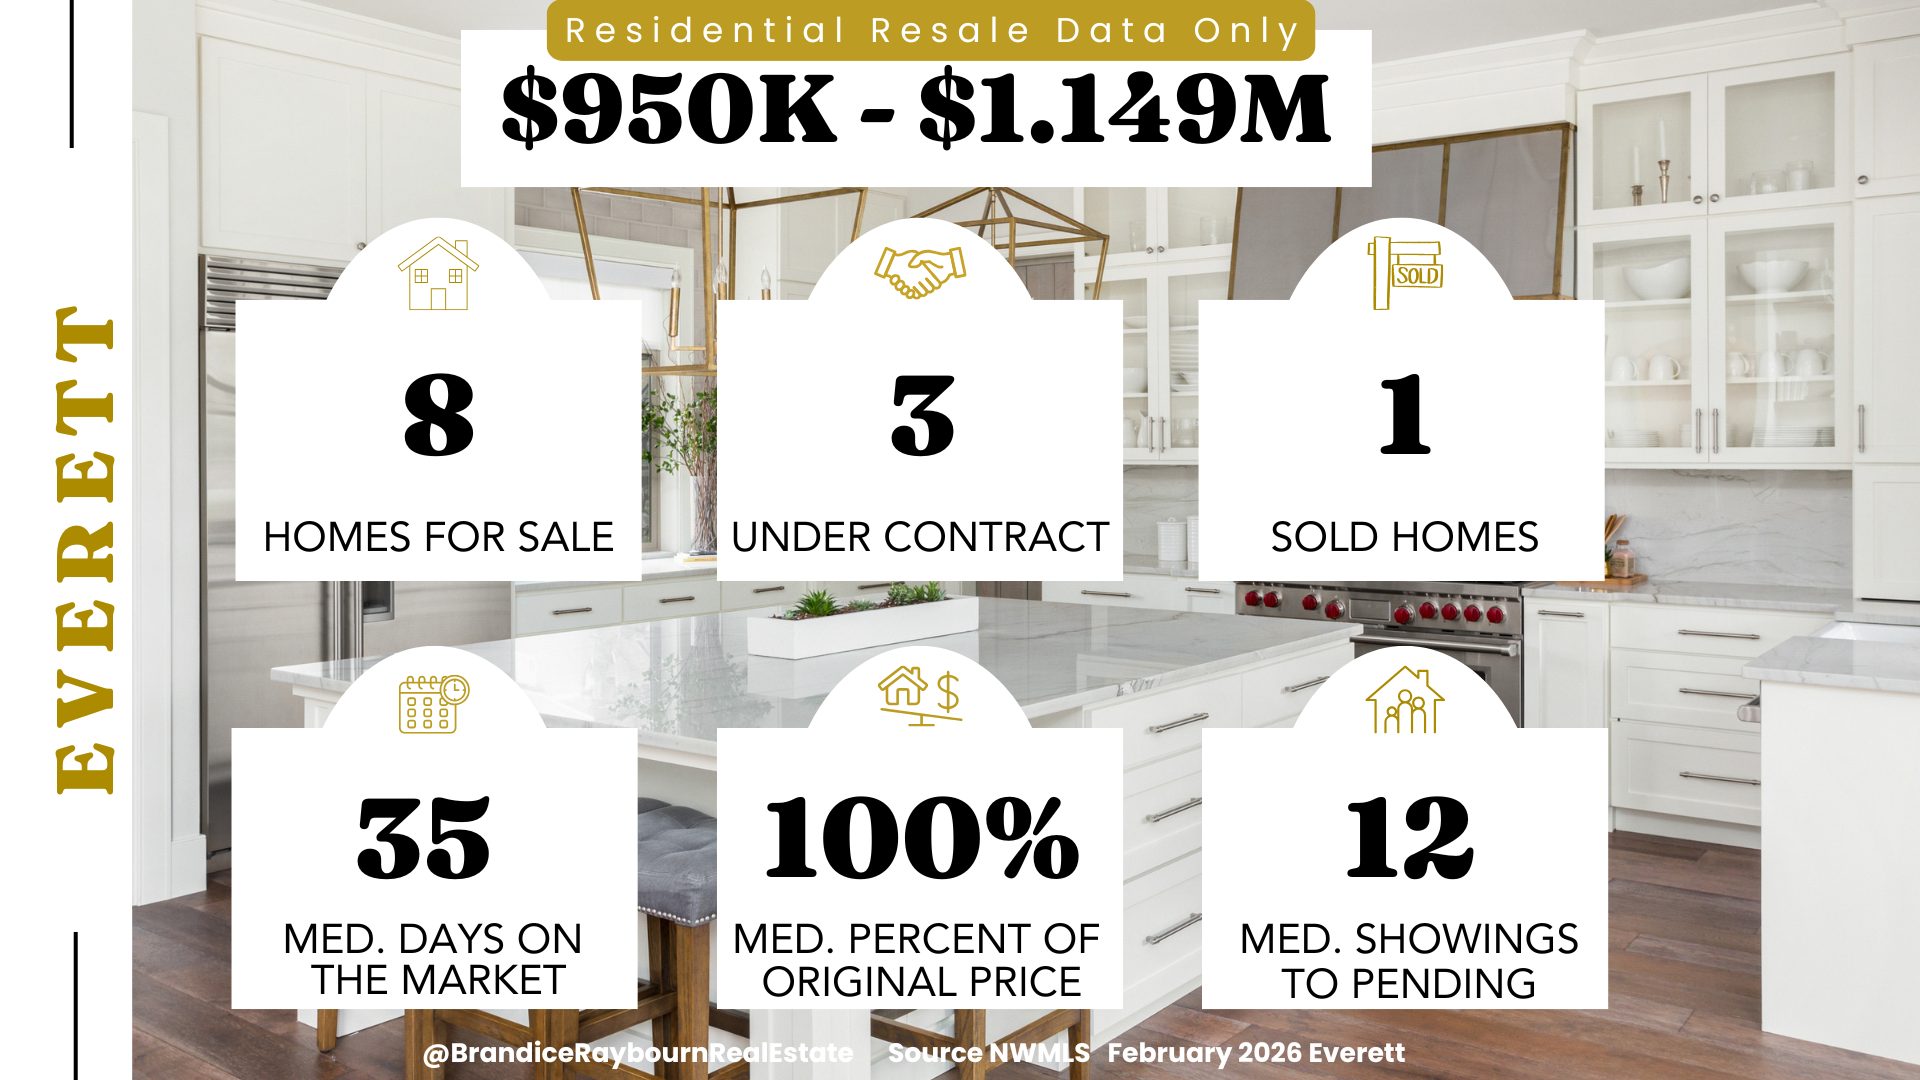
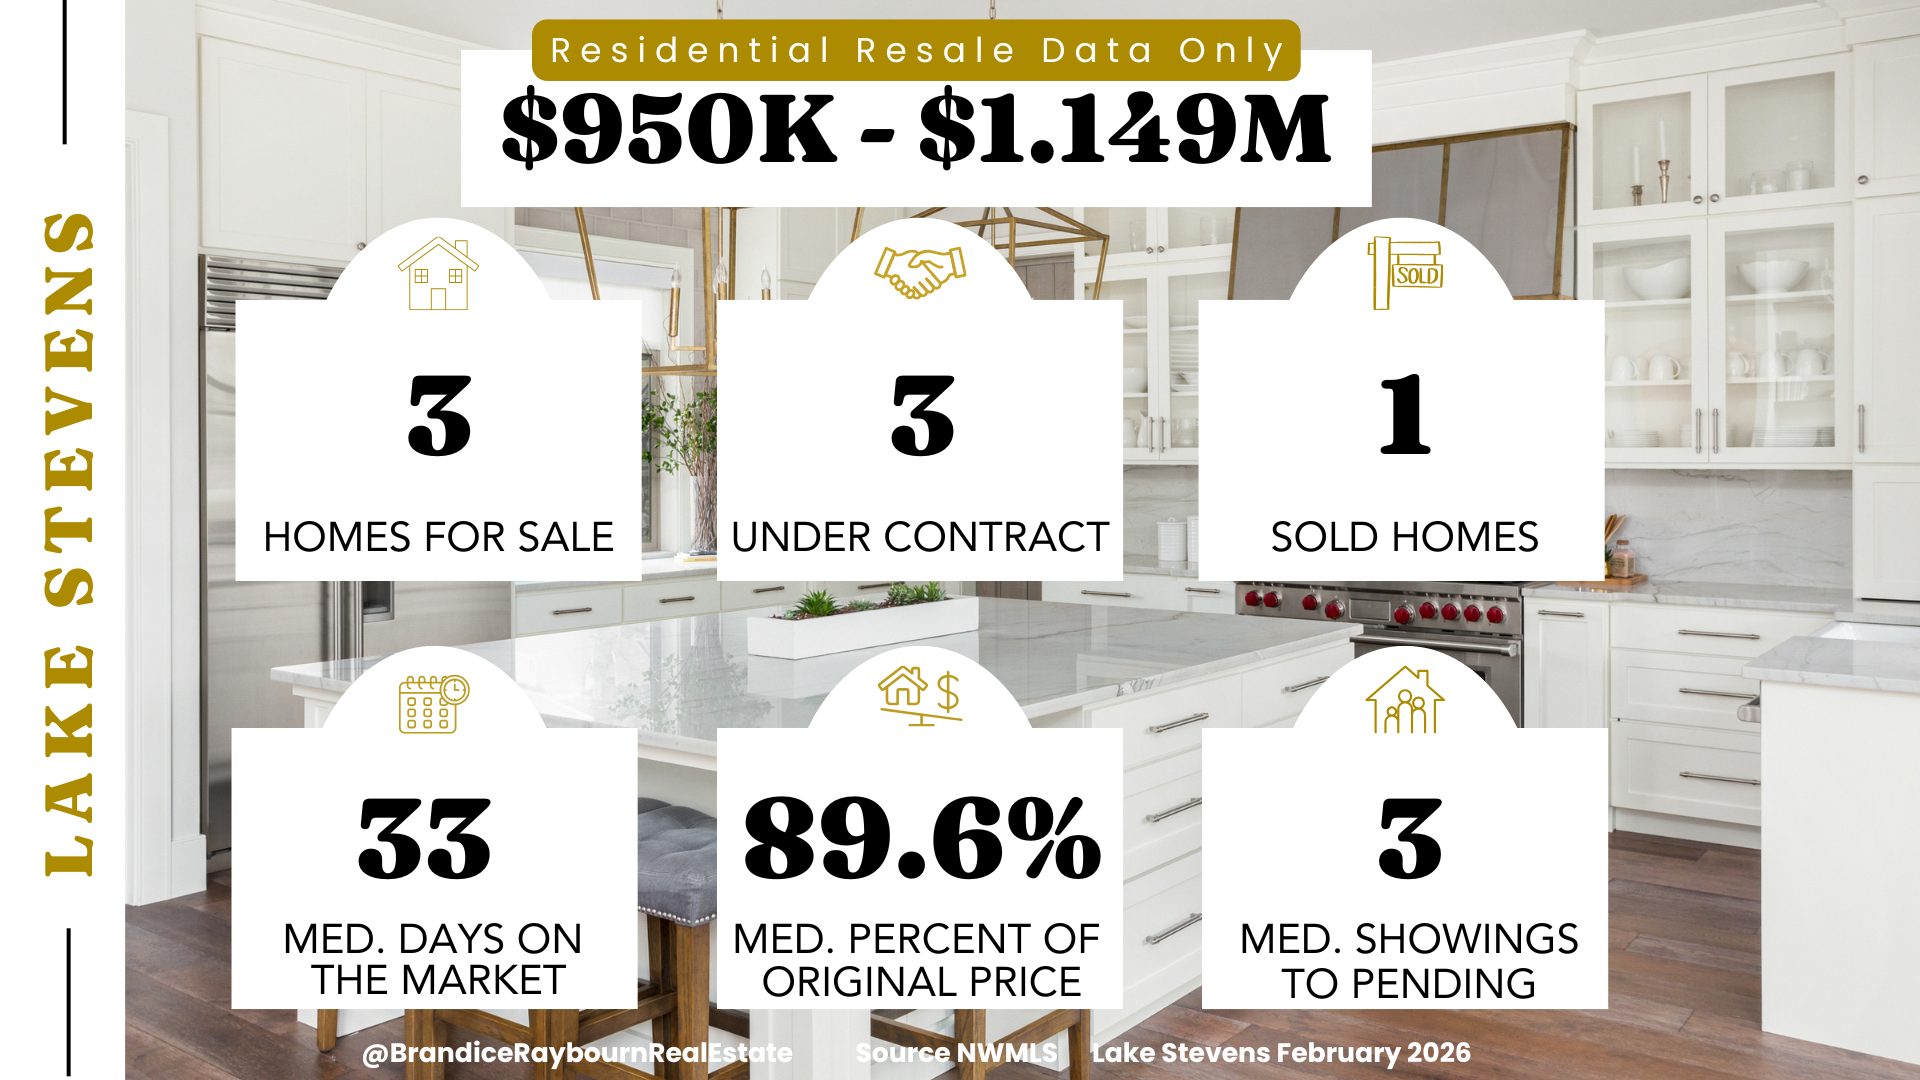
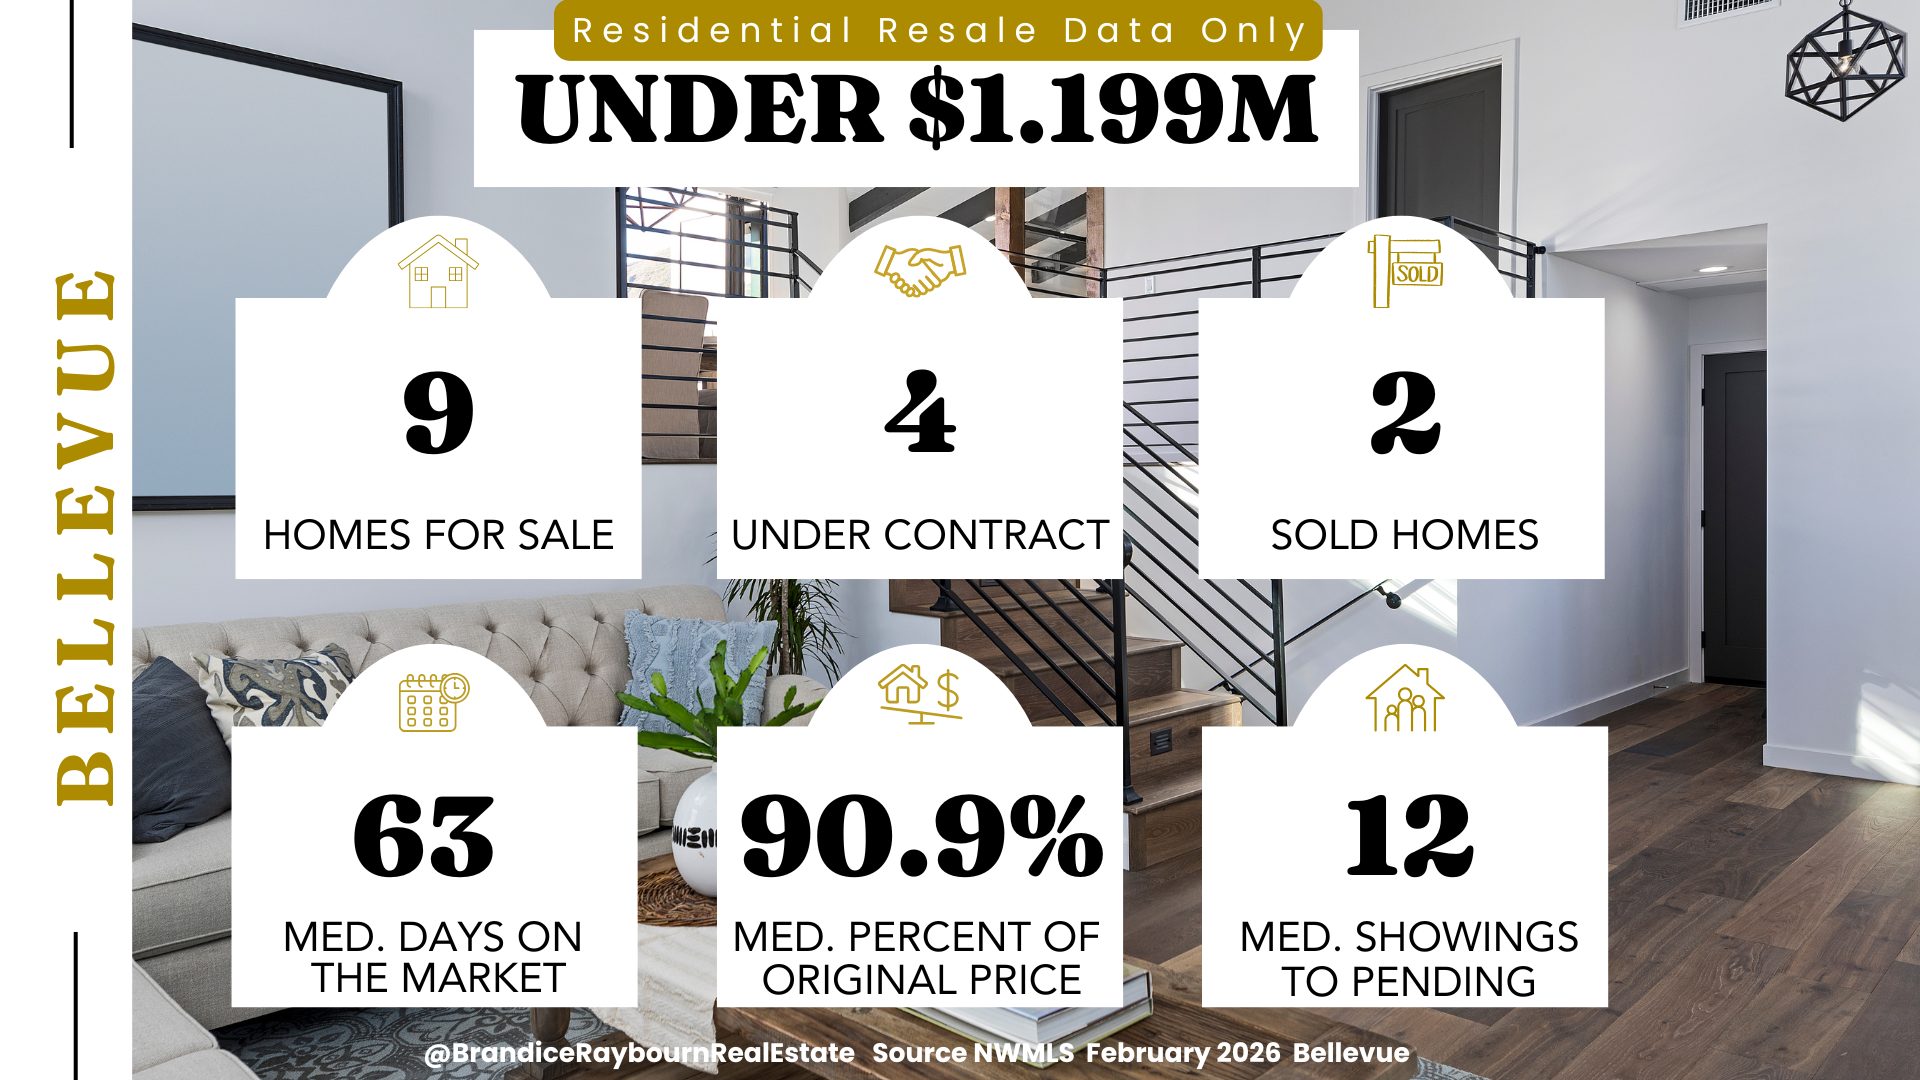
$1.05M – $1.249M
This segment is clearly slower and more buyer-friendly. Homes are taking significantly longer to sell, and buyers are analytical and patient.
Many of the homes closing in this range had been on the market for an extended period, which is pulling averages higher and contributing to longer timelines overall.
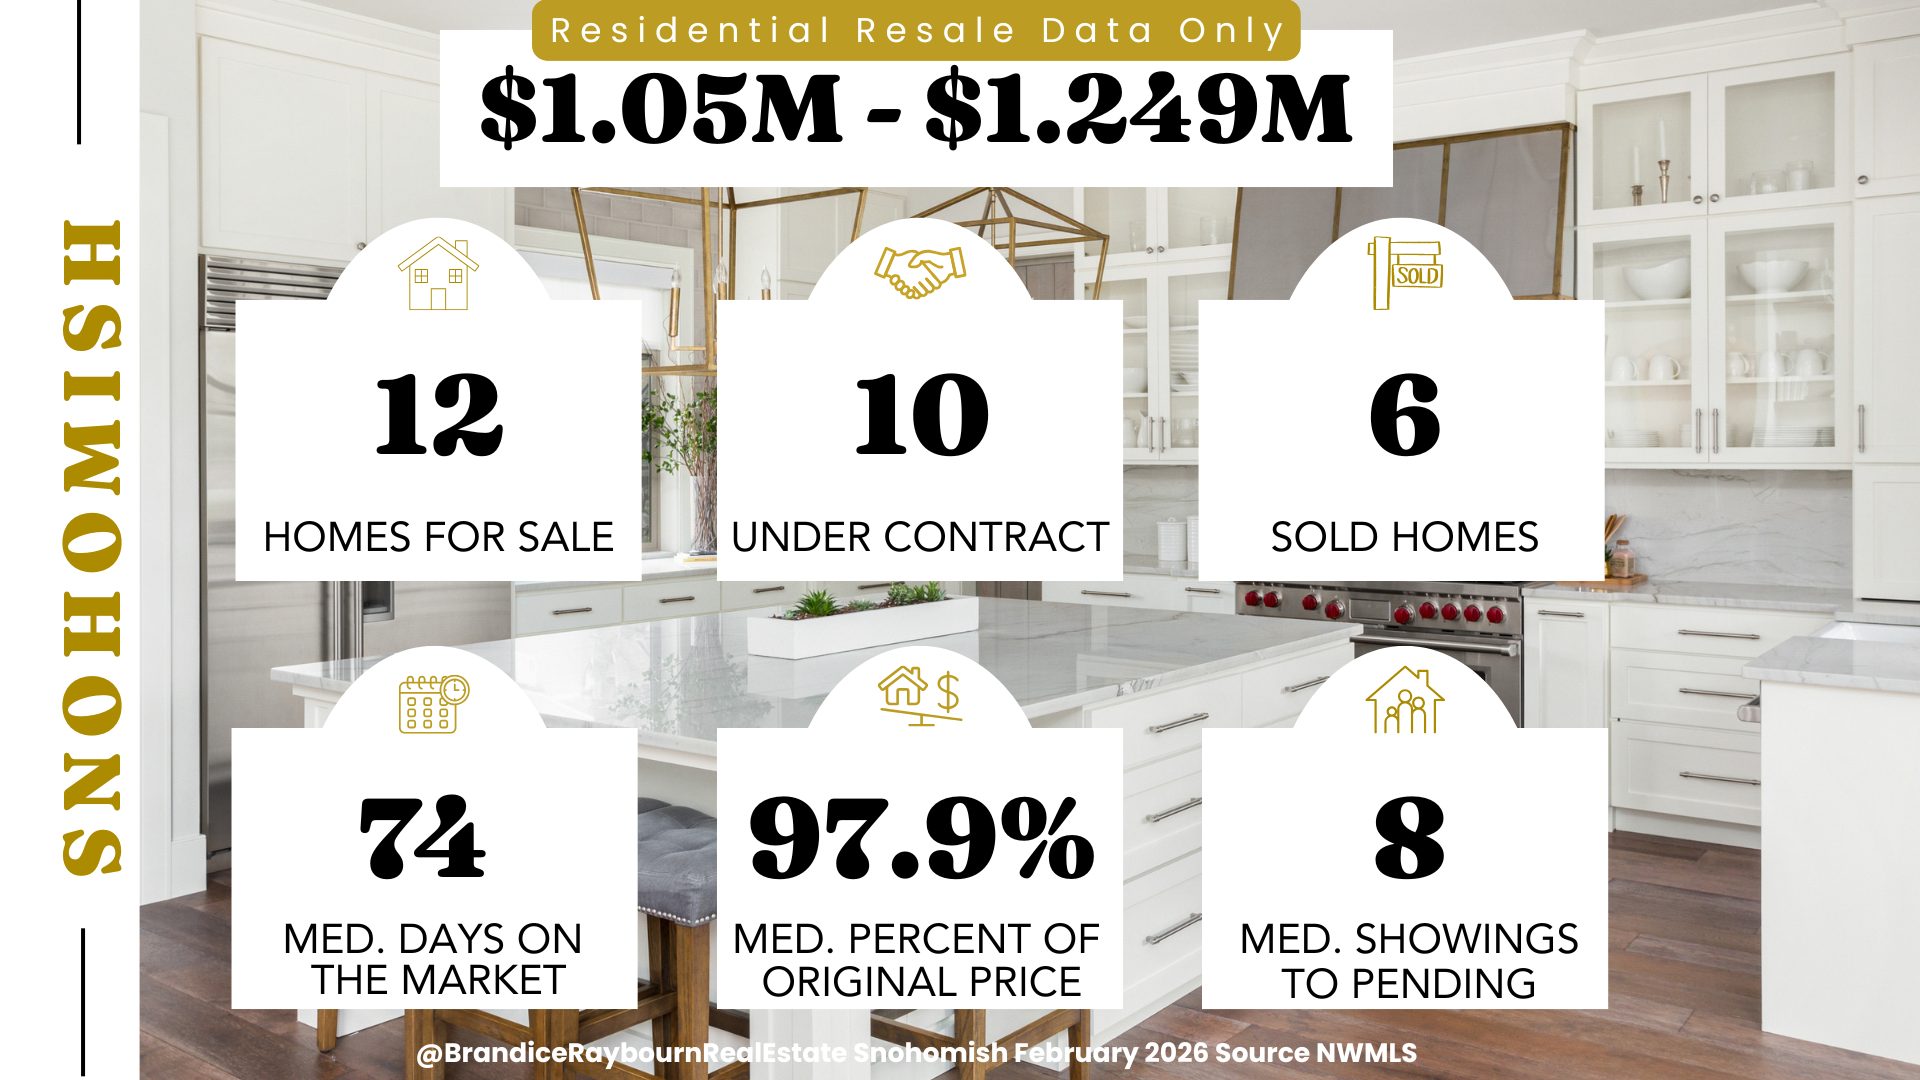
Source: NWMLS | Analysis by Brandice Raybourn
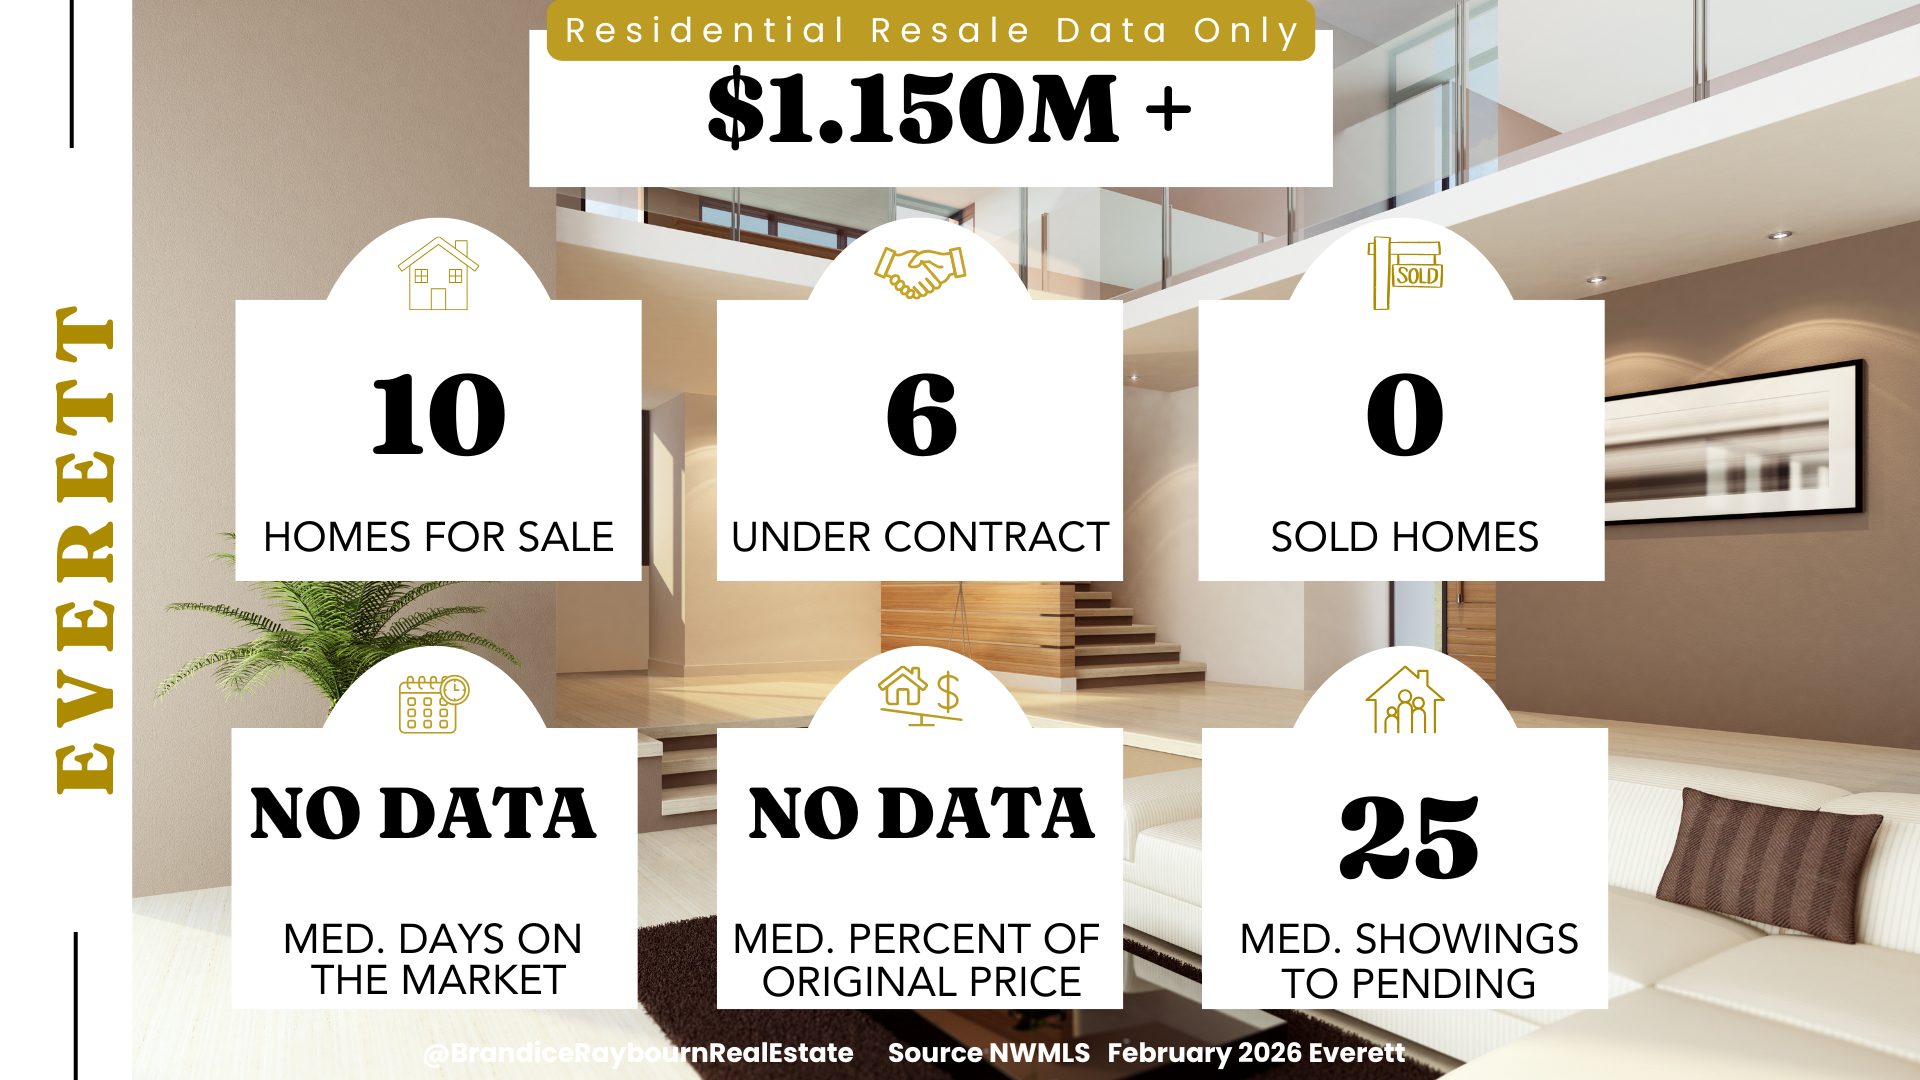
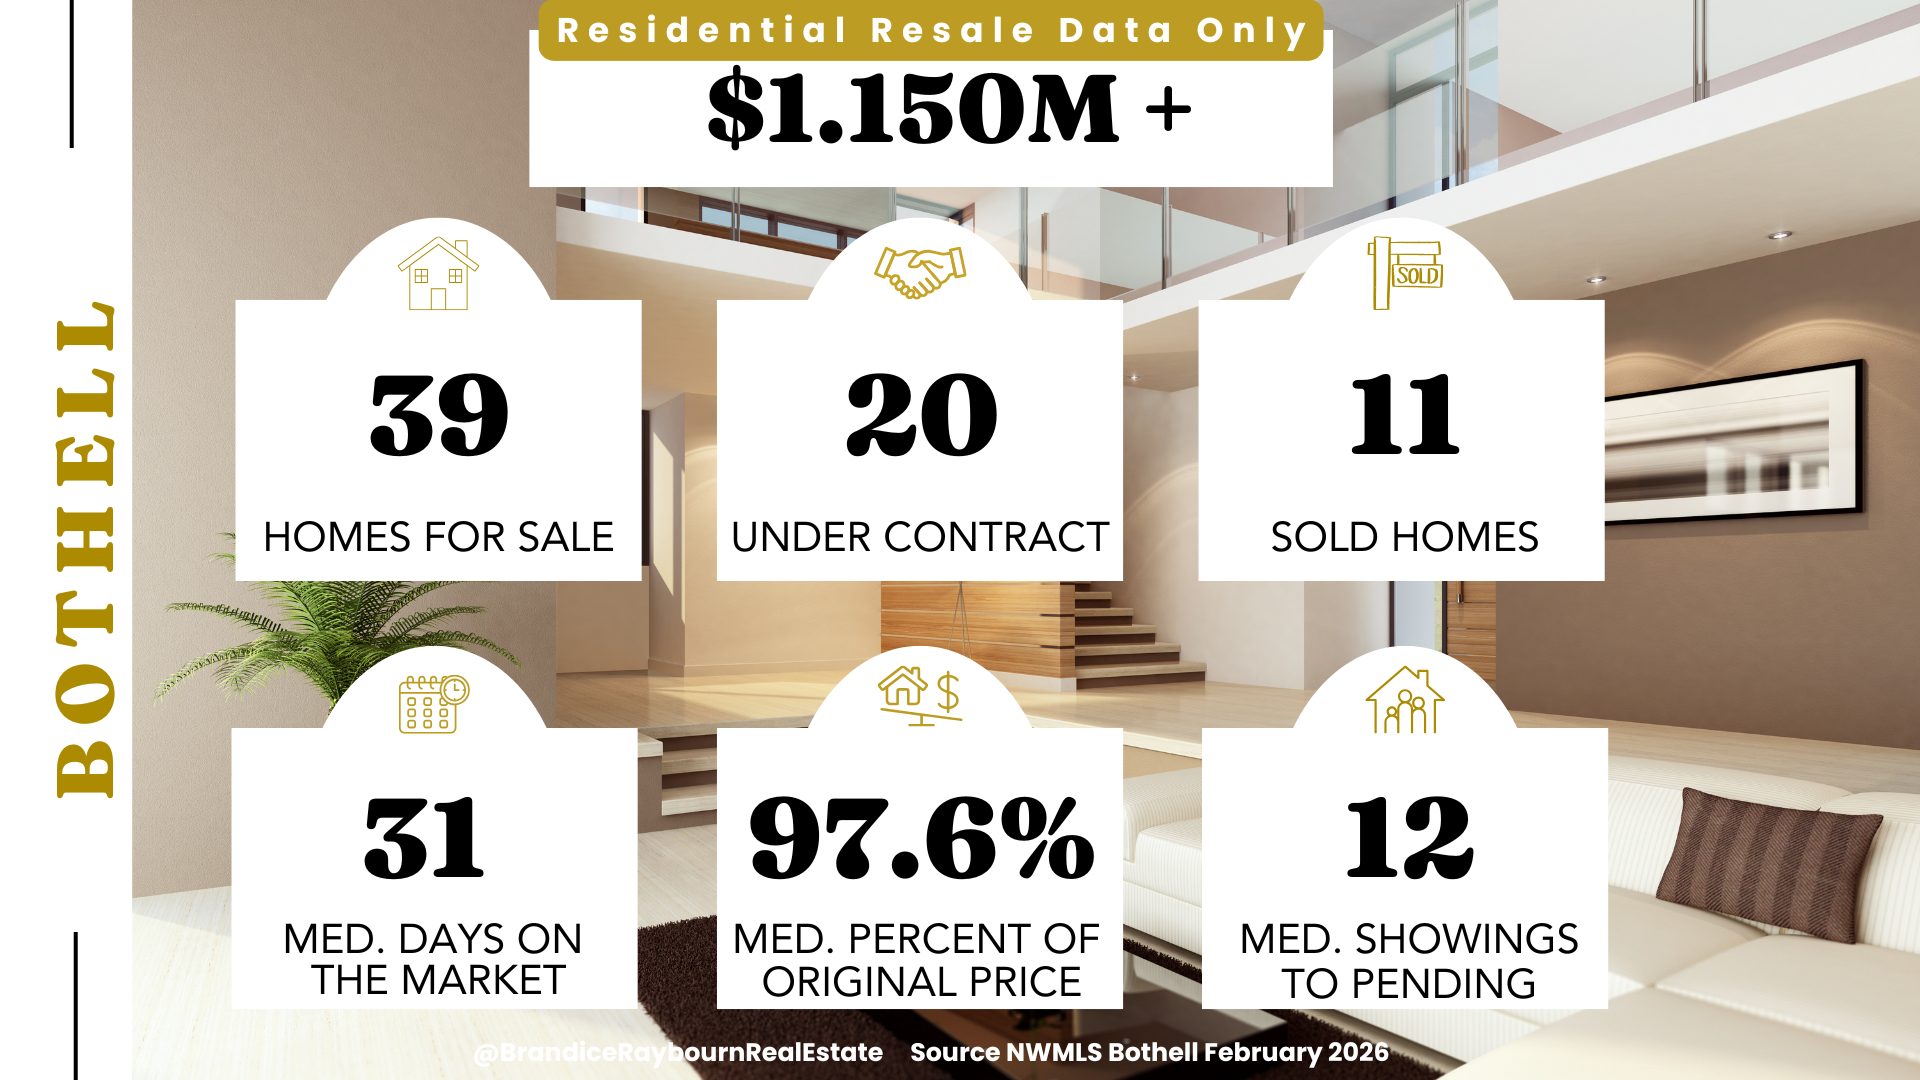
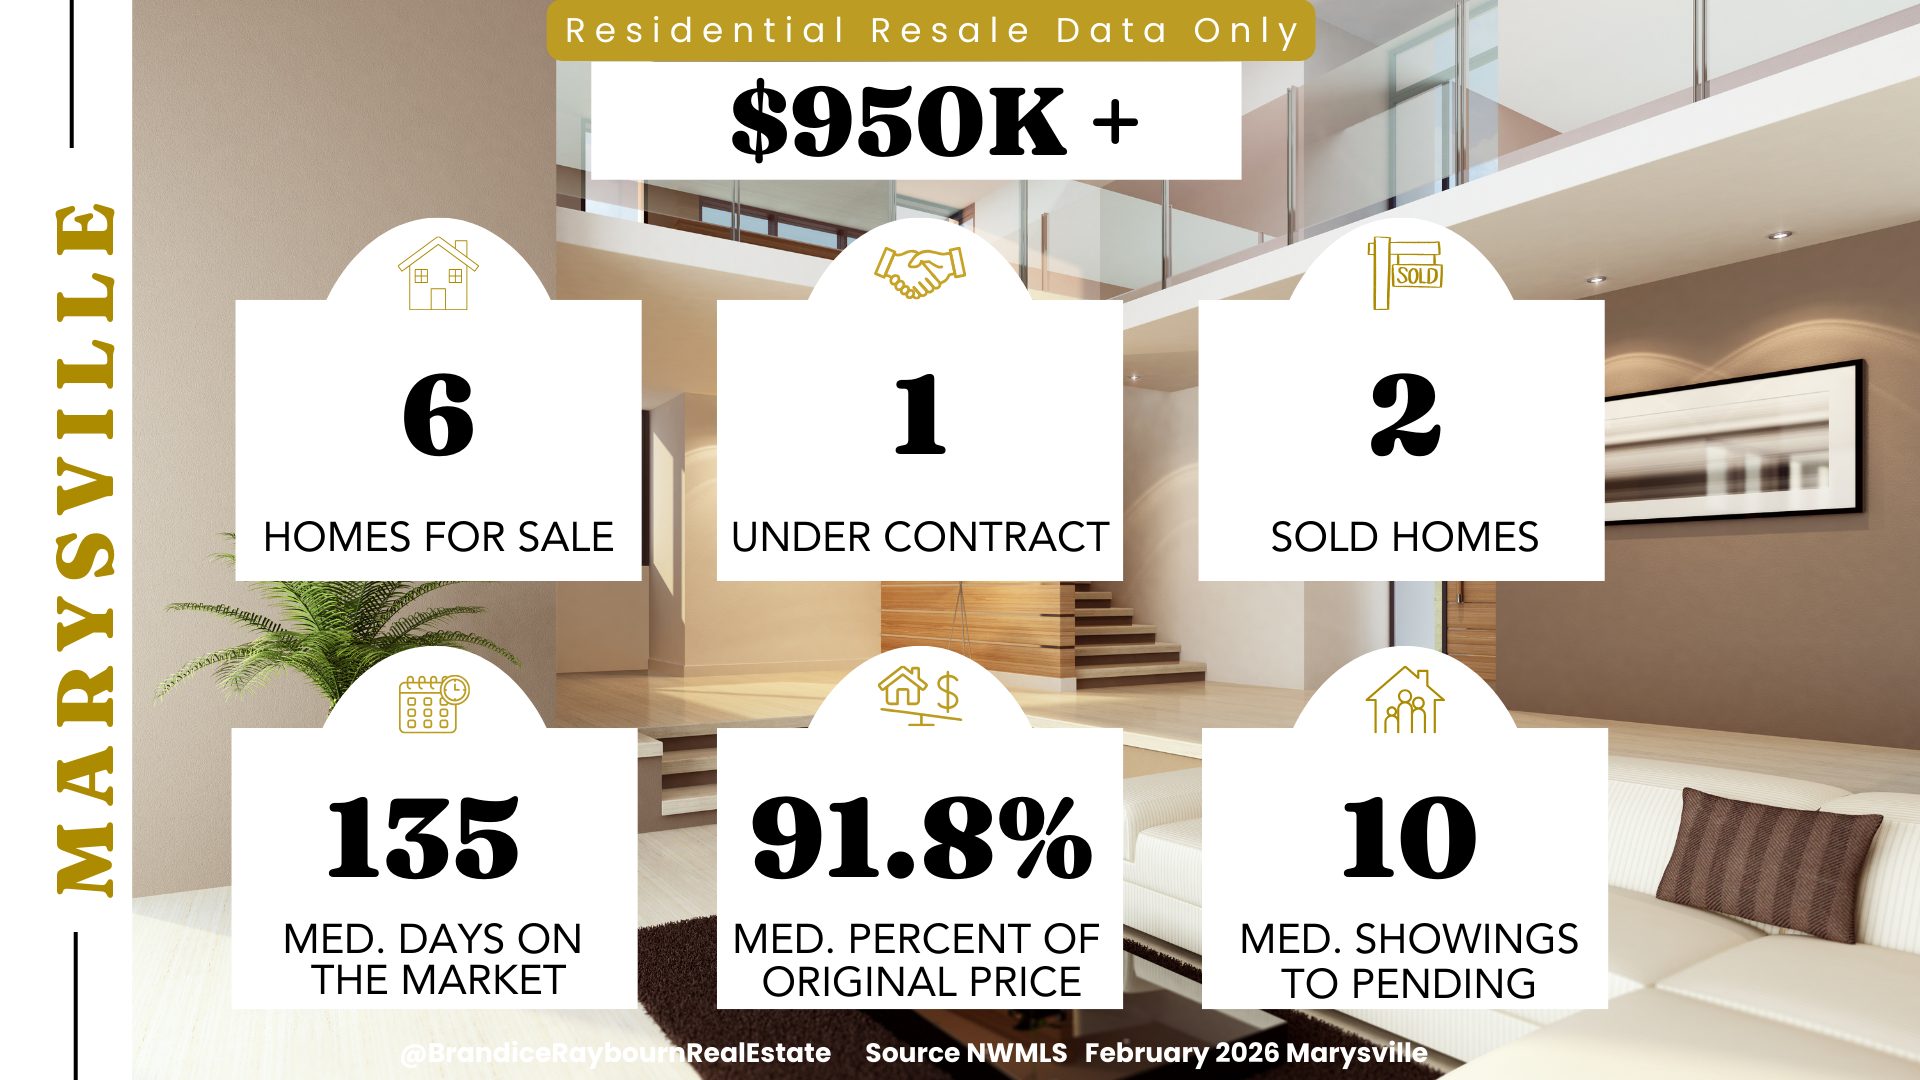
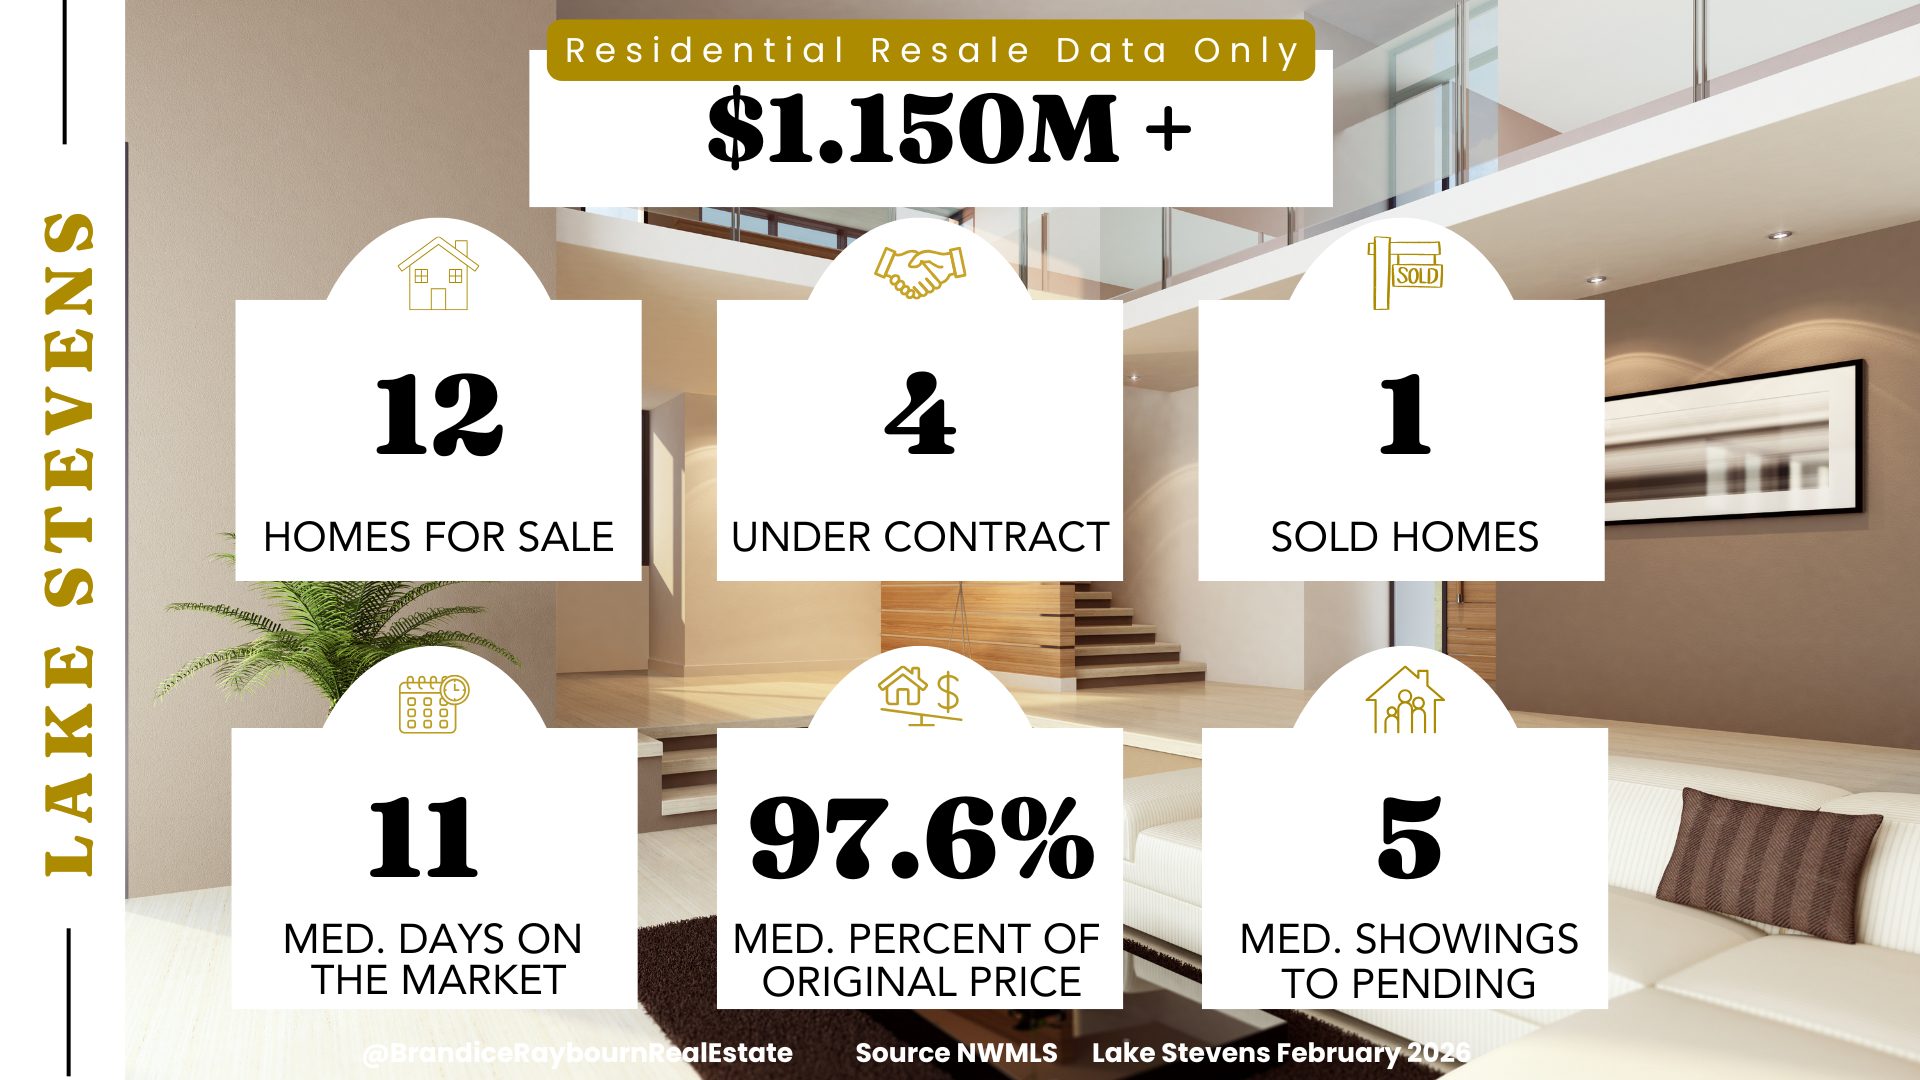
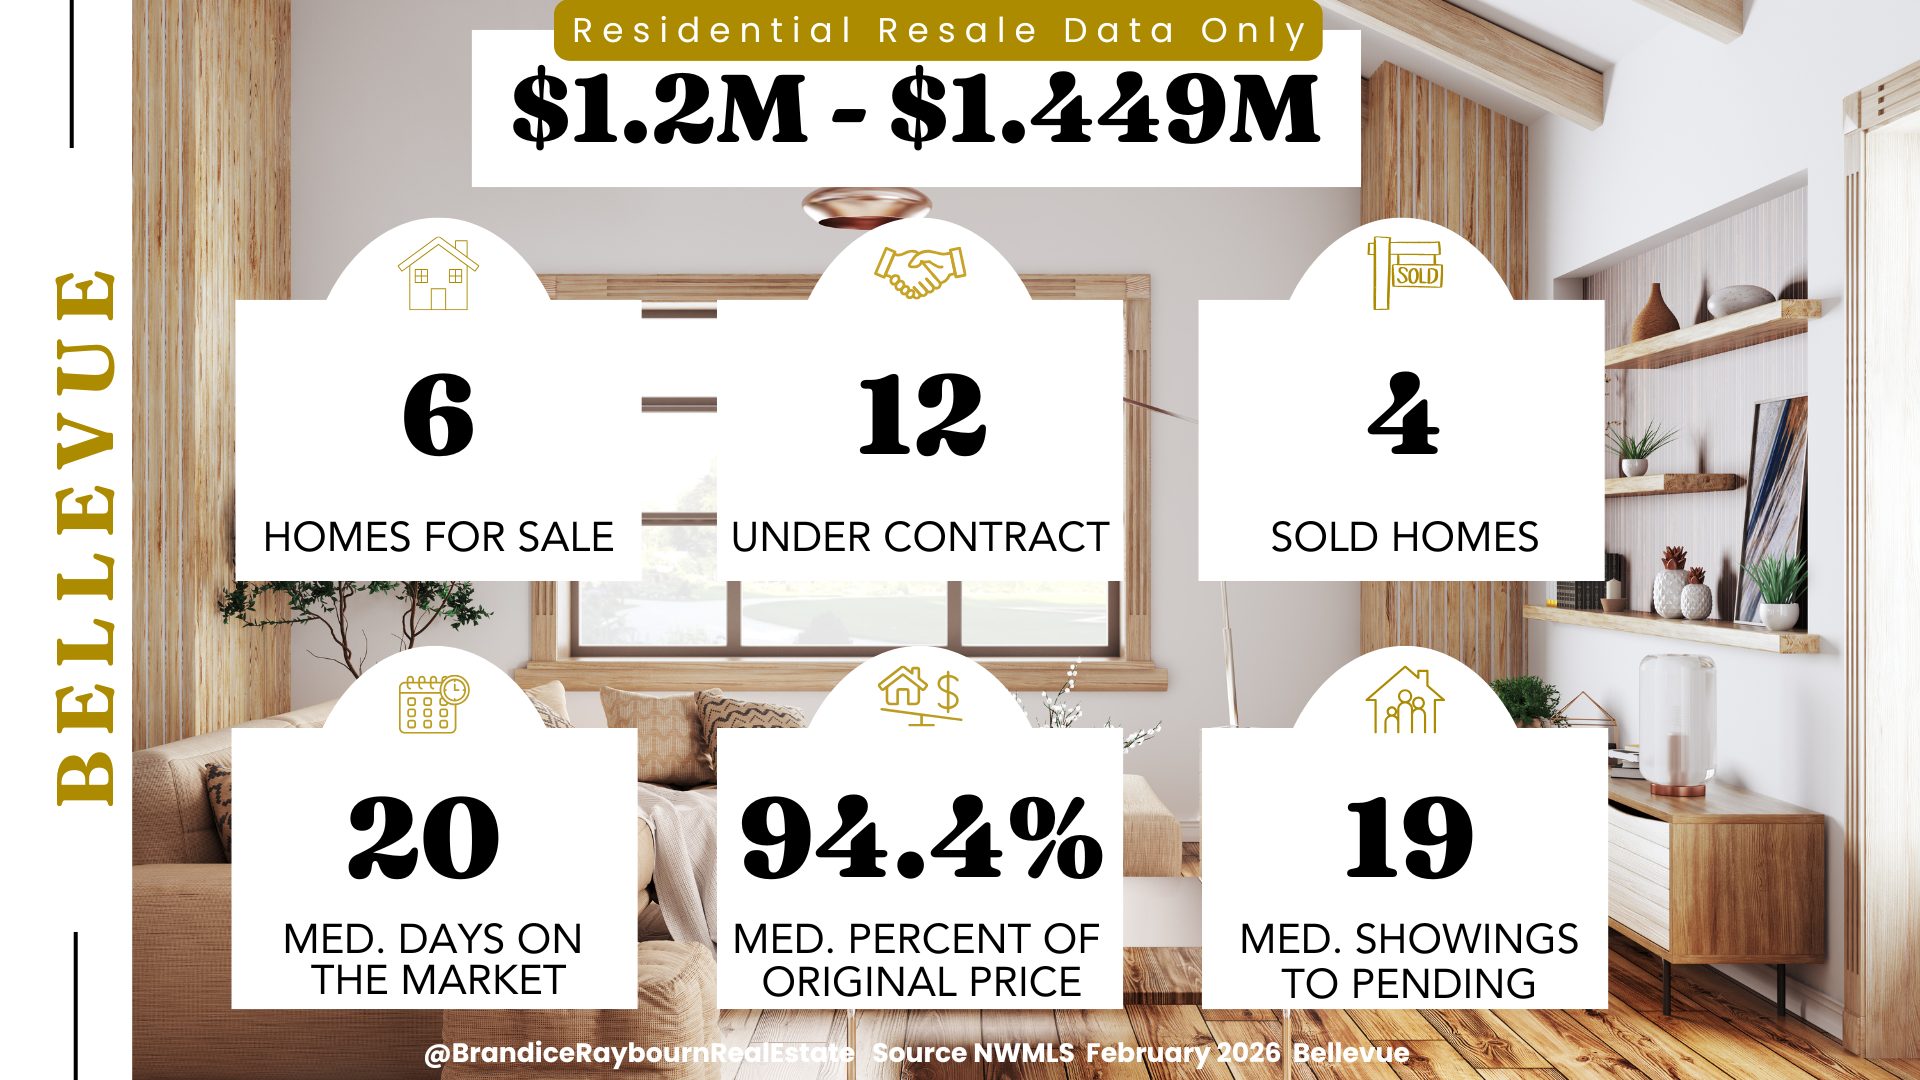
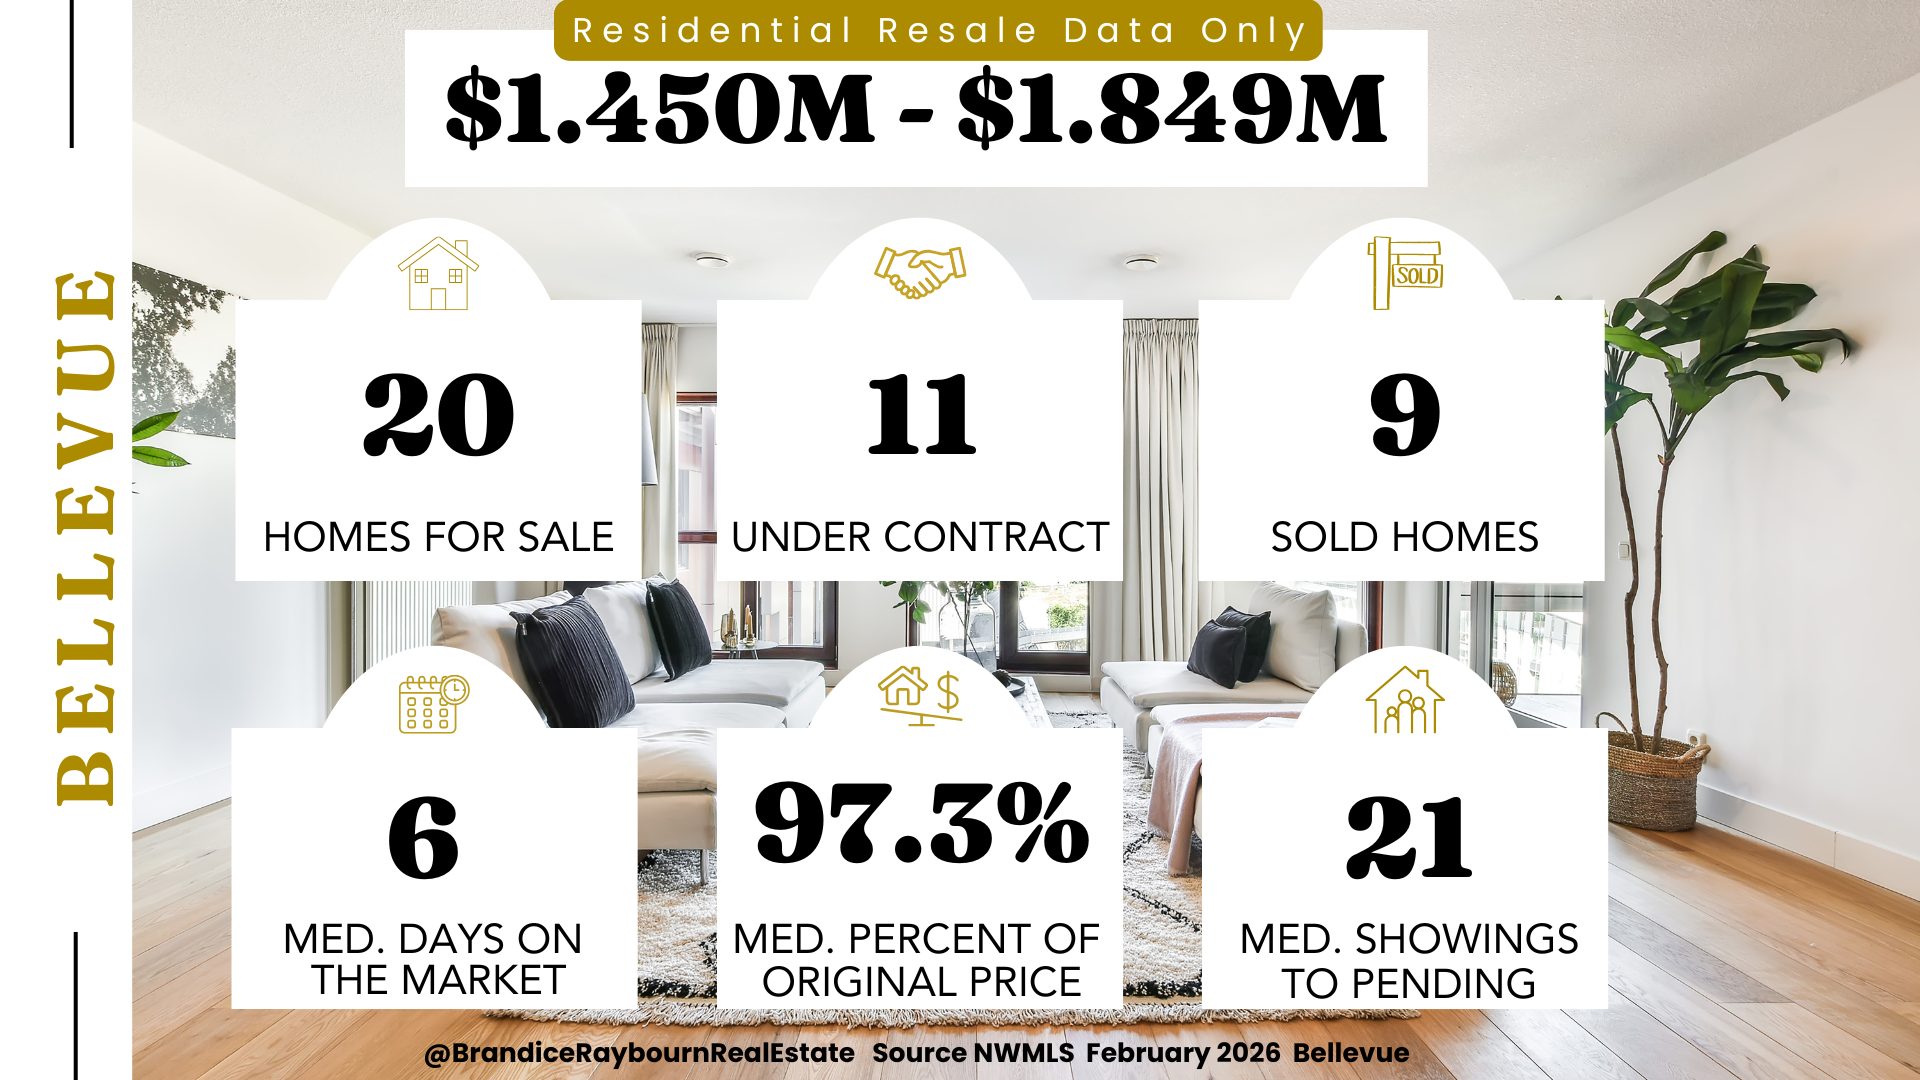
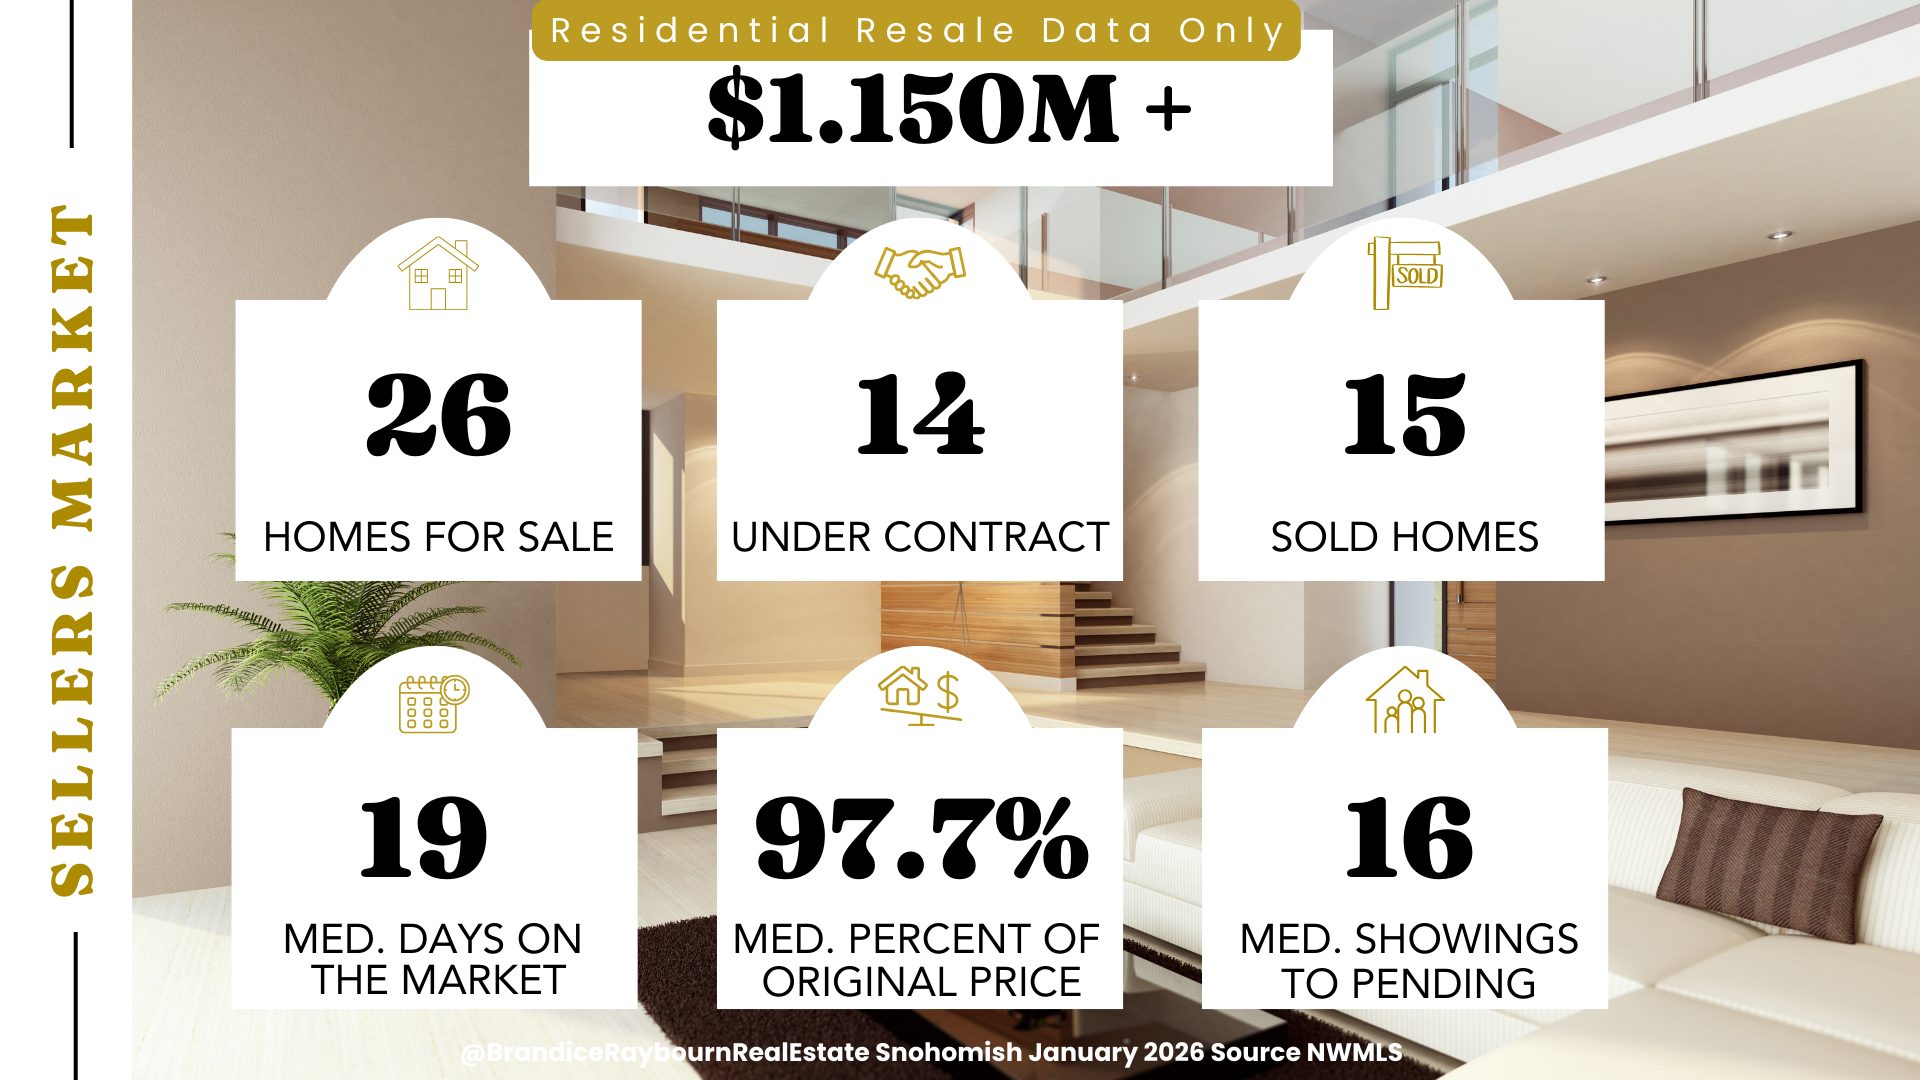
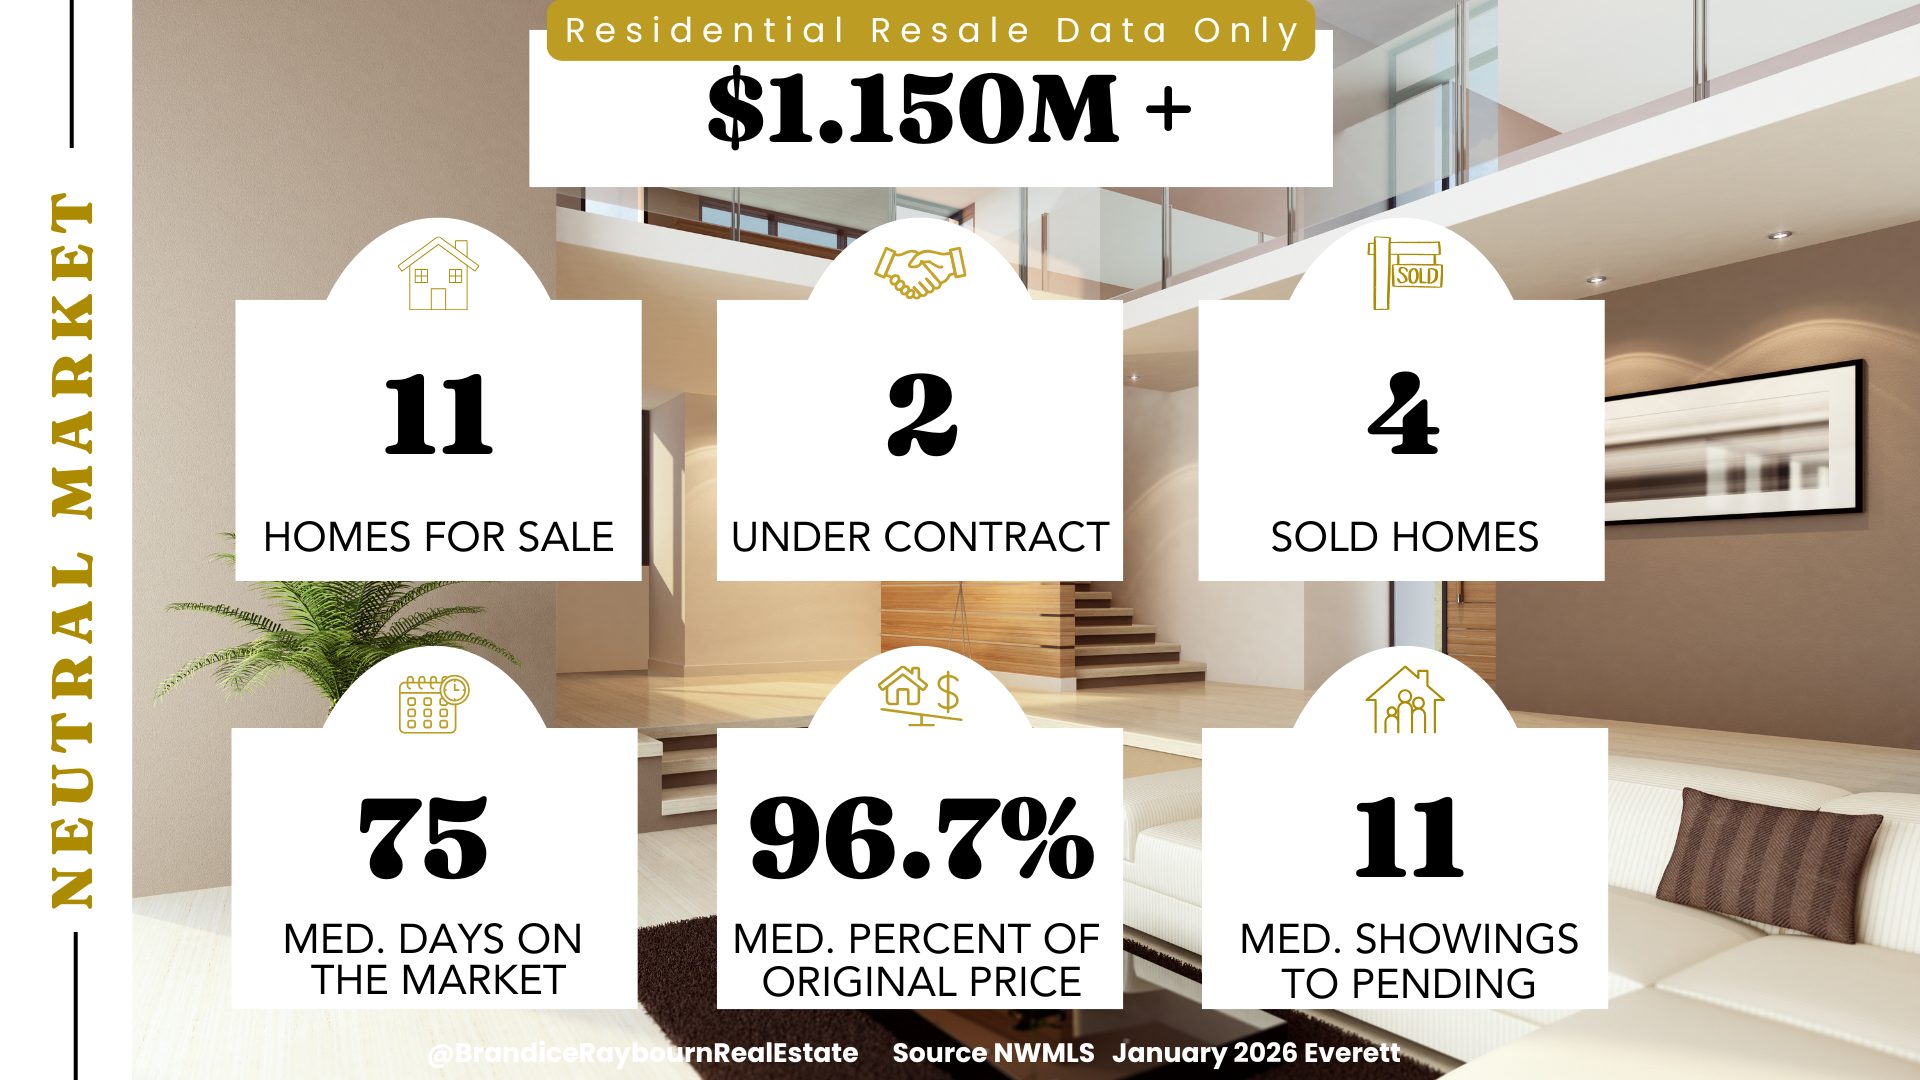
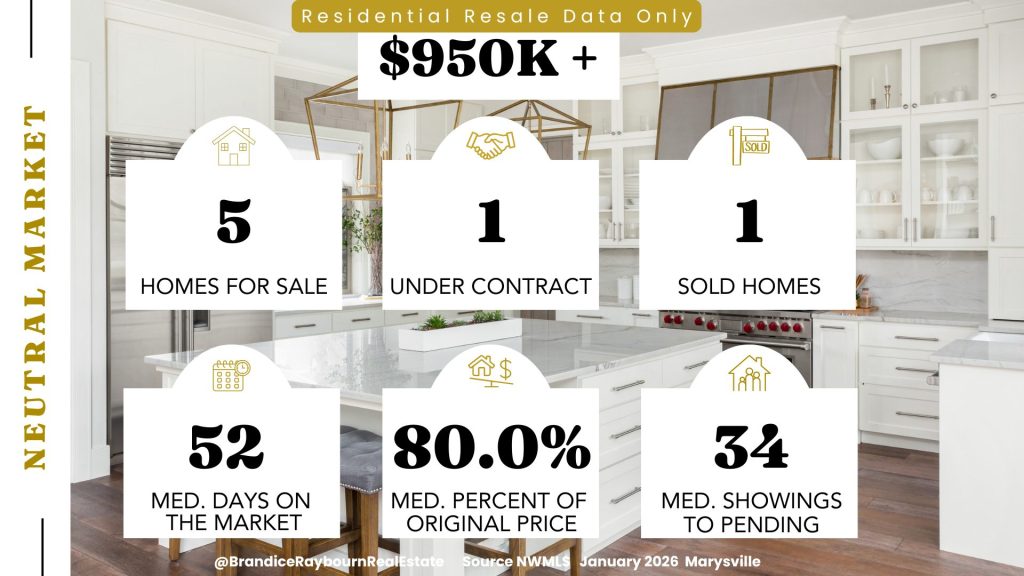
$1.25M and Above
This price range saw the highest number of homes sold this month. That does not indicate a surge in luxury demand. Instead, it reflects homes that had been sitting on the market finally finding the right buyer.
These longer timelines are skewing overall averages upward and contributing to the perception of a slower market citywide. Sellers in this range should expect patience to be part of the process unless a home truly stands out.
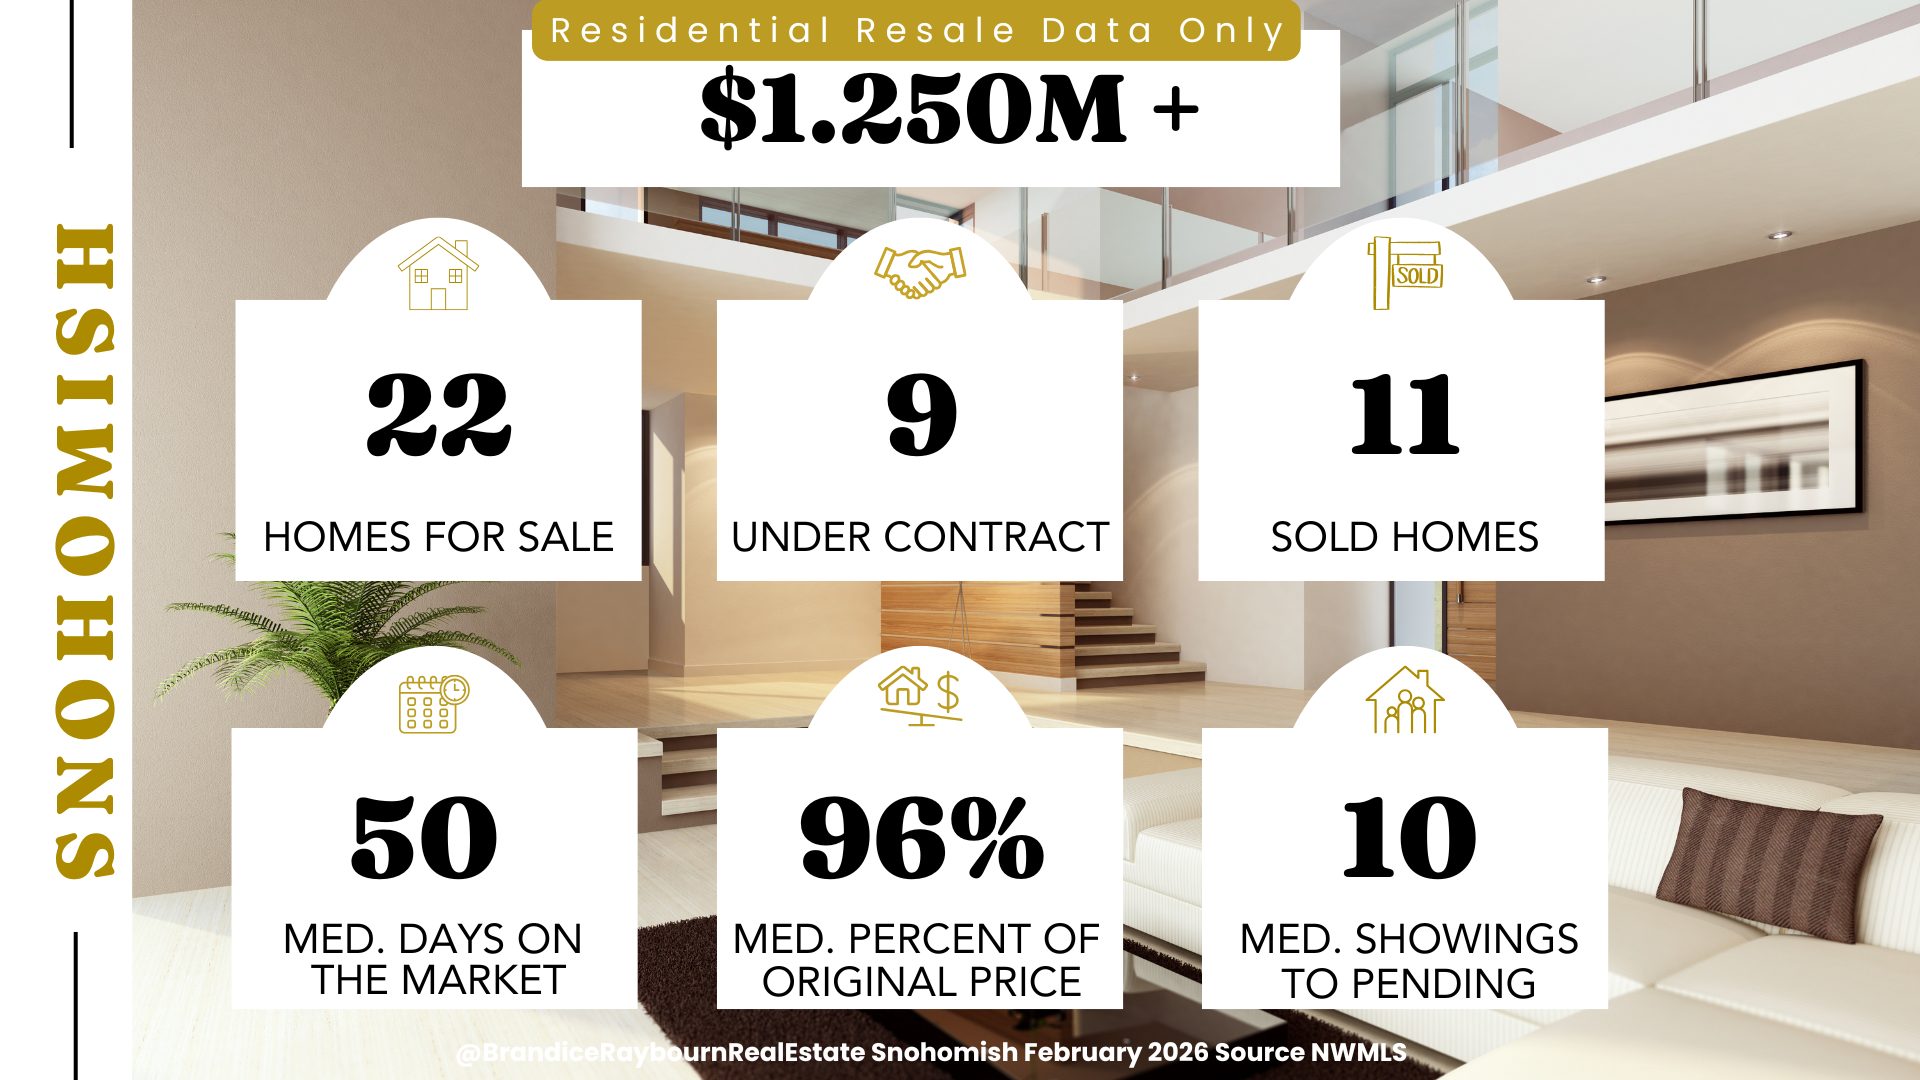
Source: NWMLS | Analysis by Brandice Raybourn
Final Thoughts
February’s Snohomish market is a clear example of seasonal slowdown combined with delayed momentum. Nearly all segments are experiencing longer days on market, but homes are still selling. Understanding that many of this month’s closings came from older listings is key to interpreting the data correctly.
Price point matters. Strategy matters. And understanding where your home fits within this slower, more deliberate market can make a meaningful difference in outcome and stress level.
Ready to Talk Through Your Situation
These are the same reports I use when advising buyers and sellers on pricing, timing, and strategy. If you want to understand how this market applies to your specific home or price range, I’m always happy to walk through it with you.

Brandice Raybourn
Coldwell Banker Danforth
Everett Real Estate Broker
brandice@snohomesbybrandice.com
425-367-3881
If you want these market updates sent straight to your inbox each month, you can sign up to receive my Snohomish market reports by email. I send the same data-driven breakdowns you see here so you can stay informed without having to hunt for them. Get the Market Report to Your Email
Snohomish Housing Market Update Whole City | January 2026
Relocating to Snohomish? Check out my community page here:
https://snohomish.snohomesbybrandice.com/home