
 Facebook
 X
X
 Pinterest
 Copy Link
Monthly Housing Market Report
Lynnwood Housing Market Update
August 2026

This report breaks down what actually happened in the Lynnwood housing market during July 2026 using real NWMLS data. We will look at the whole city, individual housing types, and residential resale price ranges because the citywide averages leave out the most interesting part of the story: buyers had a lot more choices, but they still fought hard for homes that felt like a great value and would be difficult to replace.
In One Sentence
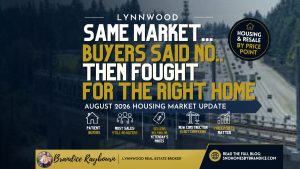
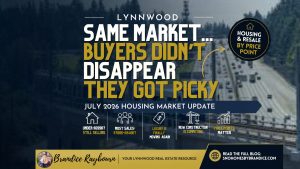
Buyers said “no thanks” a whole lot more before finally saying yes, but when the right Lynnwood home showed up, they were still willing to compete.
Who's Feeling This Market Right Now
Working in your favor
- Patient buyers: Lynnwood ended July with 339 homes for sale, and more than 130 active listings had already been sitting longer than 60 days. Buyers had real options and more time to compare.
- Sellers with a standout home: Well-priced homes in desirable locations still moved fast. Three MLS examples went under contract in four days and sold above asking.
A mixed picture
- Move-up buyers: There was more selection, especially above $850,000, but the homes with the clearest value could still attract immediate competition.
- Condo and townhome sellers: Buyers were active, but closed homes took a median of 28 and 27 days, and the middle seller received less than the original asking price.
Worth a closer look at strategy
- Sellers relying on yesterday's price: Buyers had enough alternatives to pass on a home that felt overpriced, even when they were still willing to pay over asking for a different property.
- Listings without early interest: Forty-one listings were canceled and 18 expired. Waiting without changing the price, presentation, or strategy was not working for everyone.
- Supply, how many homes buyers had to choose from.
- Buyer Demand, how quickly and actively buyers responded.
- Negotiating Power, how much of their asking price sellers kept once a buyer was found.
- Friction, listings that stalled, got canceled, or expired.
Lynnwood gave buyers plenty to choose from, but it did not eliminate competition. Buyers ignored a lot of listings, then moved fast and paid over asking when the location, condition, and price made a home feel hard to replace.
Snapshot One
Whole City · All Housing Types CombinedWhat Is Happening Across the City Right Now?
This snapshot combines residential resale, new construction, condos, and townhomes. That makes it useful for seeing the amount of activity across Lynnwood, but the citywide sales price is heavily influenced by which types of homes happened to close.
Standout Stat
339 homes for sale
That was 40.1% more inventory than Lynnwood had in July 2025, and it helps explain why buyers could be extremely selective even though some homes still received multiple offers.
Homes Available to Buyers
These numbers show how much choice buyers had during July.
Homes for Sale at the End of the Month
- July 2026
- 339
- Change From June 2026
- Up 2.7%
New Listings Added During the Month
- July 2026
- 185
- Change From July 2025
- Up 22.5%
Homes Buyers Chose
These numbers show how many sellers attracted a buyer and how many sales were completed.
Homes That Went Under Contract
- July 2026
- 111
- Change From June 2026
- No change
Homes That Completed a Sale
- July 2026
- 103
- Change From June 2026
- Down 17.6%
Typical Days Before Going Under Contract
- July 2026
- 20 days
- Change From June 2026
- 7 days slower
Typical Showings Before Going Under Contract
- July 2026
- 8 showings
- Change From July 2025
- No change
What This Really Means for Buyers
Pending sales held steady from June, so buyers were still writing contracts. The slower closed-sale median tells us the homes that made it all the way to closing were not chosen as quickly as the prior month, but closings also reflect offers written weeks earlier.
This is where the active inventory matters. More than 130 current listings had already been on the market over 60 days, while three standout July sales found buyers in four days. The 20-day median sits between two very different experiences: a small group of homes buyers wanted immediately and a much larger group they were willing to keep scrolling past.
Did Sellers Get Their Asking Price?
This percentage describes the middle closed sale, not every seller's result.
Median Percent of Original Asking Price Received
- July 2026
- 97.6%
Median Sales Price
- July 2026
- $699,995
Median Price Per Square Foot
- July 2026
- $395
What This Really Means for Sellers
The middle closed seller received 97.6% of the original asking price. On a $750,000 original list price, that works out to about $732,000, or roughly $18,000 below the price the seller first asked. That number includes the effects of price reductions and offers accepted below the original list price.
The $699,995 median sales price does not mean every Lynnwood home lost value. It reflects the mix of condos, townhomes, new construction, and residential resale that closed. Residential resale alone had a median sales price of $885,000. Price per square foot is also a broad comparison tool, not a stand-alone valuation, because size, condition, lot, layout, age, and location can change it substantially.
Listings That Did Not Sell
Canceled and expired listings came off the market without completing a sale.
Canceled Listings
- July 2026
- 41
Expired Listings
- July 2026
- 18
Total Listings That Did Not Sell
- July 2026
- 59
Looking Deeper: The Same Market Produced Bidding Wars and Give-Ups
Wow, this is where Lynnwood looked like two completely different markets. Three sellers attracted buyers in four days and closed above asking, while 59 other listings left the market canceled or expired. The sold properties were mixed too. Some sellers waited a long time and gave up a meaningful amount from the original price, while others received exactly what they hoped for.
There was no single neighborhood where every home won or lost. Buyers were sorting property by property. They rewarded clear value, desirable locations, appealing layouts, and homes that could speak to more than one type of buyer. They rejected listings that made the price harder to justify.
Lynnwood also had 59 failed listings in June, but the important point is not that the total repeated. It is that another month of strong buyer choice did not make unsuccessful listings disappear.
Snapshot Two
By Housing TypeHow Did Each Type of Home Perform?
Each housing segment is analyzed independently because buyers and sellers experience different parts of the market differently. The residential resale, new construction, condo, and townhome sections are designed to compare activity within each segment rather than break down the whole-city totals. Some NWMLS categories overlap by design. For example, a newly built condo or townhome may also be counted in the new construction segment, while other property types such as manufactured homes, land, and multifamily are included in the whole-city statistics but are not analyzed separately in this report.
Standout Stat
New construction had 60 homes for sale, but only 10 pending
Builders had more inventory than the prior two Julys, while current contract activity was less than half of July 2025. Closings remained stronger because they reflected earlier buyer decisions.
Where the Market Activity Was
Compare how many homes were available, went under contract, and completed a sale.
Residential Resale
- Homes for Sale
- 87
- Went Under Contract
- 50
- Homes Sold
- 43
New Construction
- Homes for Sale
- 60
- Went Under Contract
- 10
- Homes Sold
- 22
Condos
- Homes for Sale
- 97
- Went Under Contract
- 32
- Homes Sold
- 30
Townhomes
- Homes for Sale
- 90
- Went Under Contract
- 27
- Homes Sold
- 35
Looking Deeper: Resale Buyers Were the Most Decisive
Residential resale had 50 pending sales, more than any other category and almost as many contracts as new construction, condos, and townhomes combined. Buyers were not avoiding older homes. They were choosing the ones that made sense on price, location, and livability.
New construction changed the most from June. Inventory increased from 46 to 60, while pending sales fell from 27 to 10 and closings declined from 31 to 22. Because closings reflect contracts written earlier, the pending number gives us the more current warning that builders were facing a much more selective July buyer.
What Each Housing Type Sold For
Each card uses the median sales price reported in the July source workbook.
Residential Resale
- Median Sales Price
- $885,000
- Change From Prior Year
- Up 12.7%
- Median Price Per Square Foot
- $426
New Construction
- Median Sales Price
- $690,900
- Change From Prior Year
- Down 1.3%
- Median Price Per Square Foot
- $393
Condos
- Median Sales Price
- $487,000
- Change From Prior Year
- Down 1.4%
- Median Price Per Square Foot
- $372
Townhomes
- Median Sales Price
- $635,000
- Change From Prior Year
- Down 6.6%
- Median Price Per Square Foot
- $379
What This Really Means for Comparing Property Types
The price gaps mostly tell us that these are different products. A residential resale house, a condo, a townhome, and a new construction property do not offer the same land, square footage, ownership structure, age, or location. Their medians should not be treated as a ranking of which type gained or lost value.
The year-over-year changes are also sensitive to the mix of homes that sold. The residential resale median rose because July 2026 included a different set of 43 homes than the 33 that closed in July 2025. A comparable-sales analysis is still the right way to evaluate one specific property.
How Quickly Buyers Chose Them
These figures are based on properties that completed a sale, not every active listing still sitting on the market.
Residential Resale
- Days Before Going Under Contract
- 10 days
- Showings Before Going Under Contract
- 12 showings
New Construction
- Days Before Going Under Contract
- 15 days
- Showings Before Going Under Contract
- 2 showings
Condos
- Days Before Going Under Contract
- 28 days
- Showings Before Going Under Contract
- 7 showings
Townhomes
- Days Before Going Under Contract
- 27 days
- Showings Before Going Under Contract
- 4 showings
Looking Deeper: Fast Resale Wins Hid a Slower Attached Market
Residential resale closed in a median of 10 days, but condos and townhomes took nearly four weeks. That is a major difference in buyer speed, especially when all three categories were competing for buyers who wanted access to Lynnwood.
These medians only describe the homes that closed. A few very fast sales can pull a median down, while older inventory finally selling can push it up. The active listings still sitting beyond 60 days are not represented in these closed-sale market-time cards.
Did Sellers Get Their Asking Price?
Residential Resale
- Original Asking Price Received
- 98.5%
New Construction
- Original Asking Price Received
- 98.0%
Condos
- Original Asking Price Received
- 97.6%
Townhomes
- Original Asking Price Received
- 97.7%
What This Really Means for Attached-Home Buyers
Condos and townhomes offered the most visible negotiating room among housing types, and they also took the longest to sell. A buyer looking at attached housing had more evidence that patience, careful comparison, and a property-specific offer could matter.
That does not mean every condo or townhome seller was weak. The percentage includes price reductions and below-list offers across closed sales. A rare unit, strong location, lower dues, better condition, or an unusually good floor plan could still perform very differently.
Snapshot Three
Residential Resale Only · By Price RangeHow Did Different Residential Resale Price Ranges Perform?
Buyers usually shop within a budget, so price bands often tell us more than a single citywide number. This section includes previously owned residential houses only and excludes condos, townhomes, and new construction.
Standout Sale or Stat
A Poplar rambler sold more than 10% over asking
That sale was not the typical Lynnwood result. It shows how strongly buyers could respond when a desirable location, broadly appealing layout, and clear value came together.
Where Homes Were Available and Selling
$699,999 or Less
- Homes for Sale
- 14
- Went Under Contract
- 5
- Homes Sold
- 7
$700,000 to $849,999
- Homes for Sale
- 18
- Went Under Contract
- 21
- Homes Sold
- 13
$850,000 to $1,049,999
- Homes for Sale
- 31
- Went Under Contract
- 18
- Homes Sold
- 15
$1.05 Million or More
- Homes for Sale
- 24
- Went Under Contract
- 6
- Homes Sold
- 8
Looking Deeper: The Middle of the Market Produced the Most Contracts
The $700,000 to $849,999 range produced 21 pending sales, more than any other resale band and more contracts than the number of homes remaining for sale at month-end. The $850,000 to $1.049 million range was close behind with 18 pendings, even though it carried the most active resale inventory.
This is a good example of why active, pending, and closed numbers should be read together. Buyers had choices, but the middle two price ranges were still where the greatest number of current July decisions were happening.
How Long It Took Sold Homes to Find a Buyer
These figures are based on closed properties. Active listings may be experiencing something completely different.
$699,999 or Less
- Days Before Going Under Contract
- 5 days
- Showings Before Going Under Contract
- 19 showings
$700,000 to $849,999
- Days Before Going Under Contract
- 19 days
- Showings Before Going Under Contract
- 14 showings
$850,000 to $1,049,999
- Days Before Going Under Contract
- 9 days
- Showings Before Going Under Contract
- 8 showings
$1.05 Million or More
- Days Before Going Under Contract
- 10 days
- Showings Before Going Under Contract
- 8 showings
What This Really Means Across Price Ranges
The lowest price range moved the fastest and drew the most showings, but lower price did not automatically mean every home sold quickly. Only seven closings created that five-day median, so a few highly competitive sales had a large influence.
The $700,000 to $849,999 range is where things got interesting. It produced the most pendings, but the homes that closed took a median of 19 days. Buyers were active in that budget, yet they were not automatically rushing every listing. The well-priced tri-level near the Interurban Trail was an exception that found its buyer in four days.
The $850,000 to $1.049 million range remained comparatively quick at nine days, although that was two days slower than June's seven-day result. Buyers were still decisive, but they had 31 active choices to compare.
Did Sellers Get Their Asking Price?
$699,999 or Less
- Original Asking Price Received
- 100.0%
$700,000 to $849,999
- Original Asking Price Received
- 98.5%
$850,000 to $1,049,999
- Original Asking Price Received
- 98.4%
$1.05 Million or More
- Original Asking Price Received
- 96.1%
Looking Deeper: Buyers Paid for Homes They Could Not Easily Replace
The typical result was not a bidding war. The middle seller received full original asking price only below $700,000. Every higher range showed a median below the original list price, with the largest gap above $1.05 million.
Then there were the exceptions. A home in Alderwood Manor sold 3.2% over asking after four days. A beautiful rambler in the Poplar neighborhood sold more than 10% over asking. Another well-priced tri-level near the Interurban Trail, listed around $750,000, sold about 4% over asking after four days.
The common thread was not one neighborhood or one price. These homes offered a combination buyers could understand immediately: a desirable setting, a broadly appealing layout, and a price that made the opportunity feel clear. The Poplar rambler could speak to first-time buyers, downsizers, and anyone who simply wanted one-level living. That larger buyer pool helped create scarcity even in a city with abundant inventory.
Those sales are important because they prove buyers still had the ability and willingness to compete. They are also exceptions. The citywide middle seller received 97.6% of original asking price, 59 listings failed, and more than 130 active listings were already beyond 60 days.
Questions This Data Can Answer
What Do Buyers and Sellers Really Want to Know?
Is there still competition for homes in Lynnwood?
Yes, but it is highly property-specific. Three July sales highlighted by the MLS went under contract in four days and closed above their original asking prices, including a Poplar rambler that sold more than 10% over list. At the same time, 339 homes were available citywide and more than 130 active listings had already been on the market longer than 60 days. Competition existed where buyers saw clear value or a home that felt difficult to replace.
Where did Lynnwood buyers have the most negotiating room?
The greatest leverage showed up in higher-priced residential resale. The $1.05 million and above range received a median of 96.1% of original asking price, while the $700,000 to $849,999 and $850,000 to $1.049 million ranges received 98.5% and 98.4%. Condos also finished at 97.6%. These are closed-sale medians, so an individual home's condition, location, pricing, and competition still mattered.
What does 97.6% of original asking price mean?
It means the middle closed sale citywide finished at 97.6% of the price the seller originally asked, including any price reductions before the offer was accepted. On an original list price of $750,000, 97.6% equals about $732,000, or roughly $18,000 below the original asking price. Some sellers received more, some received less, and 59 canceled or expired listings did not sell at all.
Did Lynnwood home values fall because the citywide median sales price was $699,995?
Not necessarily. A citywide median describes the middle of the homes that closed, and Lynnwood's mix includes condos, townhomes, new construction, and residential resale at very different price levels. Residential resale alone had a median sales price of $885,000. Comparable sales for a similar home in the same micro-location are more useful for estimating an individual property's value.
Why did sold homes show 20 days on market while so many active listings were sitting longer?
The 20-day figure describes the middle property among homes that successfully closed. It does not include every listing still waiting for a buyer. More than 130 active listings had already been on the market over 60 days, while several standout homes found buyers in four days. Both experiences can exist in the same month because buyers were moving quickly on a small group of homes and passing on many others.
So What Really Happened This Month?
Buyers Passed on Plenty of Homes, Then Fought for the Ones That Made Sense
July was not a month without buyers. It was a month when buyers had enough choices to be brutally specific about which homes deserved their attention.
At first glance, the citywide numbers look slow. Lynnwood ended the month with 339 homes for sale, closed homes took a median of 20 days to attract a buyer, and the middle seller received 97.6% of the original asking price.
That first impression is incomplete because it blends four different housing types and every neighborhood into one average experience. Residential resale homes sold in a median of 10 days, while condos and townhomes took 28 and 27 days. The resale price ranges also ranged from five days below $700,000 to 19 days between $700,000 and $849,999.
Supply was a major part of the story. Buyers had 339 homes to choose from, 185 new listings entered during July, and nearly 50 new active listings appeared in the final two weeks. Pending sales still held at 111, so buyers continued to act, but they had room to reject homes that did not feel right.
The sale-to-list result makes that selectivity practical. At 97.6%, a $750,000 original list price translates to about $732,000, roughly $18,000 below asking for the middle closed seller. Above $1.05 million, the middle resale seller received 96.1% of original asking.
Then I looked at the individual sales, and wow, the market made a lot more sense. An Alderwood Manor home sold 3.2% over asking in four days. A Poplar rambler sold more than 10% over asking. A well-priced tri-level near the Interurban Trail sold about 4% above asking in four days.
Those homes were different, but they shared something important. Buyers could see the value quickly. The location was desirable, the layout appealed to a broad audience, or the price made the home stand out against everything else available. They felt difficult to replace.
The opposite experience was just as real. Forty-one listings were canceled, 18 expired, and more than 130 active homes had already been sitting for over 60 days. Looking through the sold listings, some sellers waited a long time and accepted a meaningful discount, while others received exactly what they had hoped for.
Closed-sale days on market can hide that split. A four-day bidding war and an older listing finally closing can both contribute to the same median. That is why the active inventory and failed listings matter. They show what the success-only statistics leave out.
Buyers appeared to have the most broad negotiating leverage in luxury resale, condos, and townhomes. Yet even in those categories, a property with rare features or obvious value could perform much better than the median.
This market rewarded clarity. It rewarded a price buyers could defend, a home that showed well, and a feature or location they could not find in five other listings. It did not reward simply putting a home on the market and waiting for someone to overlook the competition.
Last month's report described buyers as increasingly price sensitive. July showed what that sensitivity looked like in practice: not an unwillingness to pay, but an unwillingness to pay for a home unless the value felt obvious.
If I had to sum up July in one sentence: Lynnwood buyers said no more often, but they still fought hard when the right home gave them a clear reason to say yes.
Data is the insight.
The right strategy gets the result.
This report shows the citywide picture. Use the form below to tell me what you are planning, and I will personally prepare a market review tailored to your situation.






Looking Deeper: Buyers Had Another Option Around Every Corner
Inventory did not suddenly explode from June, but it stayed very high and another 185 listings entered the market during July. Nearly 50 new active listings also appeared during the final two weeks alone. Buyers did not have to convince themselves that one imperfect home was their only chance.
That does not mean every buyer had endless choices in every neighborhood. It means sellers were competing for attention, and the home that made its value easiest to understand had a much better chance of getting the first appointment and the strongest offer.