Facebook
 X
X
 Pinterest
 Copy Link
Monthly Housing Market Report
Marysville Housing Market Update
August 2026
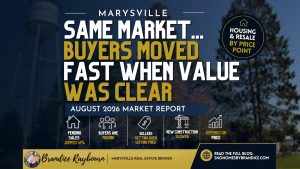
This report looks at what actually happened in the Marysville housing market during July 2026 using NWMLS data. The most useful story is not simply that inventory increased. It is where buyers acted, which homes created urgency, and why a market with 330 available homes still produced several aggressive bidding situations.
In One Sentence
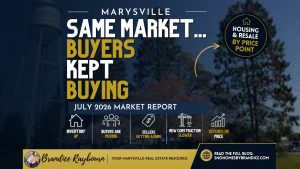
Marysville buyers had 330 homes to choose from and increased pending sales by 41% from last July. Most residential resale demand was concentrated below $750,000, where buyers moved quickly on homes that looked like a strong value, even as more than 150 active listings remained on the market for over 60 days.
Who's Feeling This Market Right Now
Working in your favor
- Buyers who are willing to compare carefully, 330 homes were available at the end of July, giving buyers 95 more choices than one year earlier.
- Sellers entering below $750,000 with a compelling home, this is where 52 of the 57 residential resale pendings occurred, and several of July's strongest bidding examples began in these price ranges.
A mixed picture
- Sellers watching strong pending numbers, pending sales increased sharply, but a pending is not yet a closing. July's 121 pendings and 99 closings measure different groups of properties and different points in the transaction cycle.
- New construction buyers and builders, activity improved substantially from last July, but 117 available homes still gave buyers room to negotiate. The typical closed sale finished about 2.4% below its original asking price.
Worth a closer look at strategy
- Owners competing against older inventory, more than 150 active listings had already been exposed to the market for over 60 days. A new listing must be positioned against both recent arrivals and the homes buyers have already passed over.
- Sellers reviewing an unsuccessful listing, 15 listings were canceled and 10 expired in July. Relisting without changing the pricing, presentation, condition, or marketing approach risks repeating the same result.
- Supply, how many homes buyers had to choose from.
- Buyer Demand, how quickly and actively buyers responded.
- Negotiating Power, how much of their asking price sellers kept once a buyer was found.
- Friction, listings that stalled, got canceled, or expired.
July revealed two very different Marysville markets at the same time. Well-positioned homes, particularly below $750,000, could trigger an immediate response. Homes that did not compare as favorably had to compete with a growing backlog of choices.
Snapshot One
Whole City · All Housing Types CombinedWhat Is Happening Across the City Right Now?
This snapshot looks at the entire Marysville housing market. It shows how much choice buyers had, how many homes went under contract or closed, and how many listings came off the market without selling. Later sections focus on residential resale, new construction, condos, and townhomes, so the totals will not always match because the citywide figures include additional property types that are not broken out separately in this report.
Homes Available to Buyers
These numbers show how much choice buyers had during July.
Marysville ended July with 330 homes for sale, 40% more than July 2025 and nearly twice the number available in July 2024.
Homes for Sale at the End of the Month
- July 2026
- 330
- Change From July 2025
- Up 40%
New Listings Added During the Month
- July 2026
- 168
- Change From July 2025
- Up 25%
Homes Buyers Chose
These numbers show how many sellers attracted a buyer and how many sales were completed.
Pending sales jumped 41% from last July, while closed sales increased 4%. Buyers were active, but many of July's contracts had not yet reached closing by month-end.
Homes That Went Under Contract
- July 2026
- 121
- Change From July 2025
- Up 41%
Homes That Completed a Sale
- July 2026
- 99
- Change From July 2025
- Up 4%
Typical Days Before Going Under Contract
- July 2026
- 13 days
- Change From July 2025
- Unchanged
Typical Showings Before Going Under Contract
- July 2026
- 6 showings
- Change From July 2025
- 3 fewer showings
How Close Closed Sales Came to the Original Asking Price
This percentage describes the middle closed sale, not every seller's result.
The typical closed sale received 99.4% of its original asking price, the same as last July. That citywide middle result sits alongside several individual homes that sold substantially above asking.
Median Percent of Original Asking Price Received
- July 2026
- 99.4%
- Plain-Language Meaning
- The middle closed sale finished about 0.6% below its original asking price.
Average Sales Price
- July 2026
- $602,290
- Plain-Language Meaning
- Down 1.1% from last July, which may reflect the mix of homes sold rather than a uniform change in individual home values.
Median Price Per Square Foot
- July 2026
- $360
- Plain-Language Meaning
- Up 6.8% from July 2025, even while the average sales price moved slightly lower.
Listings That Did Not Sell
Canceled and expired listings came off the market without completing a sale.
Twenty-five Marysville listings left the market without selling in July. At the same time, more than 150 active listings had already been available for over 60 days.
Canceled Listings
- July 2026
- 15
- Plain-Language Explanation
- The seller or listing broker withdrew the home before it sold.
Expired Listings
- July 2026
- 10
- Plain-Language Explanation
- The listing agreement ended before the home found a buyer.
Total Listings That Did Not Sell
- July 2026
- 25
- Plain-Language Explanation
- Canceled and expired listings combined.
Active Listings on Market More Than 60 Days
- July 2026
- More than 150
- Plain-Language Explanation
- A substantial part of the active market was still waiting for a buyer at the beginning of August.
What July's Citywide Numbers Reveal
The increase in pending sales matters, but it does not erase the pressure created by 330 available homes.
Marysville recorded 121 pending sales in July, up 41% from last year, while closed sales increased only 4% to 99. Those figures are not expected to match because pending and closed sales represent different properties at different stages. Still, the jump in new contracts shows that buyers were actively making decisions during the month.
The bigger strategic issue is the size of the competing inventory. With 168 new listings arriving and more than 150 active homes already beyond 60 days on market, buyers could afford to compare closely. A listing did not need to be perfect, but it needed to make sense against a long list of alternatives.
Snapshot Two
By Housing TypeHow Did Each Type of Home Perform?
This snapshot compares residential resale homes, new construction, condos, and townhomes. The numbers come from separate NWMLS filters, so each category should be read as its own market rather than added together.
Where the Market Activity Was
Compare how many homes were available, went under contract, and completed a sale.
Residential resale produced the most closings, while new construction carried almost as many active listings. Townhome inventory tripled from last July, although only one townhome closed.
Residential Resale
- Homes for Sale
- 122
- Went Under Contract
- 57
- Homes Sold
- 53
New Construction
- Homes for Sale
- 117
- Went Under Contract
- 34
- Homes Sold
- 23
Condos
- Homes for Sale
- 20
- Went Under Contract
- 10
- Homes Sold
- 2
Townhomes
- Homes for Sale
- 34
- Went Under Contract
- 12
- Homes Sold
- 1
How Quickly Buyers Chose Them
These figures are based on properties that completed a sale, not every active listing still sitting on the market.
Condos had the fastest closed-sale median at 7 days, but that figure is based on only two closings. The one townhome closing took 106 days, making it especially important not to generalize from that single sale.
Residential Resale
- Typical Days Before Going Under Contract
- 9 days
- Typical Showings Before Going Under Contract
- 8 showings
New Construction
- Typical Days Before Going Under Contract
- 22 days
- Typical Showings Before Going Under Contract
- 4 showings
Condos
- Typical Days Before Going Under Contract
- 7 days
- Typical Showings Before Going Under Contract
- 4 showings
Townhomes
- Typical Days Before Going Under Contract
- 106 days
- Typical Showings Before Going Under Contract
- 3 showings
How Close Sellers Came to Their Original Asking Price
This translates the median percentage received into plain language.
Residential resale held at 100% of original asking in the middle sale. Condo sellers finished slightly above asking, but that result reflects only two closings.
Residential Resale
- Typical Share of Original Asking Price Received
- 100.0%
- What That Means
- The middle closed resale received its full original asking price.
New Construction
- Typical Share of Original Asking Price Received
- 97.6%
- What That Means
- The typical new construction seller received about 2.4% less than the original asking price.
Condos
- Typical Share of Original Asking Price Received
- 100.9%
- What That Means
- The middle result was about 0.9% above asking, based on only two closed sales.
Townhomes
- Typical Share of Original Asking Price Received
- 99.2%
- What That Means
- The one closed townhome seller received about 0.8% less than the original asking price.
Where the Monthly Averages Need Context
Residential resale and new construction produced enough activity to show a broader pattern. Condo and townhome results were much more sensitive to individual sales.
Residential resale accounted for 53 closings and moved in a median of 9 days, making it the most useful category for understanding the typical July experience. New construction also regained momentum, with 34 pendings and 23 closings compared with 10 pendings and 12 closings last July.
The condo category had only two closings, and the townhome category had one. The townhome's 106 days on market is accurate for that sale, but it should not be read as the normal timeline for every Marysville townhome. Small samples can describe what closed without describing the entire category.
Snapshot Three
Residential Resale Only · By Price RangeHow Did Different Residential Resale Price Ranges Perform?
Buyers often shop by budget before they shop by neighborhood. These price bands show where inventory accumulated, where closed homes moved fastest, and where sellers kept the most negotiating power.
Where Homes Were Available and Selling
The two price ranges below $750,000 accounted for 52 of Marysville's 57 residential resale pending sales. Above $750,000, 32 homes were available but only 5 went under contract.
$599,999 or Less
- Homes for Sale
- 40
- Went Under Contract
- 27
- Homes Sold
- 24
$600,000 to $749,999
- Homes for Sale
- 50
- Went Under Contract
- 25
- Homes Sold
- 22
$750,000 to $949,999
- Homes for Sale
- 26
- Went Under Contract
- 2
- Homes Sold
- 5
$950,000 or More
- Homes for Sale
- 6
- Went Under Contract
- 3
- Homes Sold
- 2
How Long It Took Sold Homes to Find a Buyer
These figures are based on closed properties. Active listings may be experiencing something completely different.
Closed homes under $600,000 moved fastest at 6 days. The $600,000 to $749,999 range took 15 days, despite producing nearly as many pending sales.
$599,999 or Less
- Typical Days Before Going Under Contract
- 6 days
- Typical Showings Before Going Under Contract
- 8 showings
$600,000 to $749,999
- Typical Days Before Going Under Contract
- 15 days
- Typical Showings Before Going Under Contract
- 10 showings
$750,000 to $949,999
- Typical Days Before Going Under Contract
- 12 days
- Typical Showings Before Going Under Contract
- 5 showings
$950,000 or More
- Typical Days Before Going Under Contract
- 40 days
- Typical Showings Before Going Under Contract
- 4 showings
How Much Sellers Negotiated
This translates the median percentage received into plain language.
The middle closed sale received its full original asking price in both ranges below $600,000 and from $750,000 to $949,999. The two closings at $950,000 or more finished considerably below their original asking prices.
$599,999 or Less
- Typical Share of Original Asking Price Received
- 100.0%
- What That Means
- The middle closed sale received its full original asking price.
$600,000 to $749,999
- Typical Share of Original Asking Price Received
- 99.6%
- What That Means
- The typical seller received about 0.4% less than the original asking price.
$750,000 to $949,999
- Typical Share of Original Asking Price Received
- 100.0%
- What That Means
- The middle closed sale received its full original asking price.
$950,000 or More
- Typical Share of Original Asking Price Received
- 91.7%
- What That Means
- The middle result was about 8.3% below asking, based on only two closed sales.
The Listings That Changed the Conversation
Several of July's strongest sales started in the price ranges with the largest buyer pool, then closed high enough to appear in the next bracket.
A home beside the Northpointe Park Trail went pending in three days and sold about 6.92% above its original asking price, roughly $50,000 over list. Because the offer pushed the final price higher, the sale appears in the $750,000 to $949,999 closed-sale range even though the home entered the market below it.
In Sunnyside, an extensively renovated home on a lot larger than 10,000 square feet sold about 5.15% above asking. Another rambler in a similar starting range went pending in six days and closed about 8.9% above its original list price.
A Cedarcrest-area home near the golf course and Bayview Trail produced one of the clearest reactions of the month. It was positioned to sell quickly, went pending in five days, and closed about 12.18% above asking. Its final price also moved it into the next reporting bracket.
Those sales help explain why the closed-price bands do not always show where buyer competition began. The original list price drew buyers into the conversation. The winning offer determined where the sale was ultimately counted.
My Take
July's most useful number may be 52. That is how many residential resale homes went pending below $750,000, representing more than 91% of all resale pendings for the month.
This does not mean every home below $750,000 was easy to sell. It means the largest buyer pool was shopping there, and a listing that combined the right price with strong condition, renovations, lot utility, or location had more opportunities to create competition.
For sellers, the goal is not to copy the final price of a home that received multiple offers. The better lesson is to study what caused buyers to engage before the bidding began.
Questions Created by July's Results
What Deserves a Closer Look This Month?
Why did pending sales rise 41% while closed sales increased only 4%?
Pending and closed sales do not measure the same group of homes. A July pending may close in August or later, while many July closings first went under contract in an earlier month. The 121 pending sales show that buyer commitments accelerated during July. The 99 closed sales show what completed during the same month. The pending increase is meaningful, but it should not be treated as 121 finished transactions.
Where was Marysville's largest residential resale buyer pool?
Below $750,000. The two lower price ranges produced 52 of Marysville's 57 residential resale pendings in July, or more than 91% of the segment's pending activity. That concentration helps explain why several well-priced homes in those ranges drew fast offers and closed above asking.
Why should the condo and townhome numbers be read differently from residential resale?
Residential resale had 53 July closings, while condos had two and townhomes had one. With only one or two sales, an individual property's condition, location, pricing history, or time on market can determine the entire monthly median. Those figures accurately describe the homes that closed, but they are not a broad rule for every condo or townhome in Marysville.
Market Summary
Marysville's Buyer Activity Had a Clear Price Center
The market's strongest current was below $750,000, but the outcome still depended on how each home compared with the choices around it.
Pending sales increased sharply across the city, and more than 91% of residential resale pendings occurred below $750,000. Several homes that started in those price ranges created enough competition to close well above asking and move into a higher final-price bracket.
At the same time, 25 listings left the market without selling and more than 150 active listings had already passed 60 days on market. July's results do not support one simple conclusion that applies to every Marysville home. They show where the buyer pool was deepest, what kinds of listings earned an immediate reaction, and why strategy still mattered even during a month with stronger contract activity.
Data is the insight.
The right strategy gets the result.
This report shows the citywide picture. Use the form below to tell me what you are planning, and I will personally prepare a market review tailored to your situation.