
 Facebook
 X
X
 Pinterest
 Copy Link
Bothell Housing Market Update March 2026
By Brandice Raybourn
Quick Take
Sometimes I look at these numbers and think, this is exactly why I break the data up the way I do for my clients. The big city stats never tell the full story.
If you just glance at the overall numbers, Bothell looks strong. Days on market is down. Homes are hovering right around full price. The median sales price jumped again.
But once you separate it by housing type and price range, it becomes much more specific.
One resale range is lifting the overall percent of list price.
One housing type pushed the citywide median price up just from a few higher sales last month.
One price range had only one sale, so the data there needs to be read carefully.
And one range currently has the longest days on market in the entire city.
This is exactly why I break it down every month instead of relying on headline numbers.
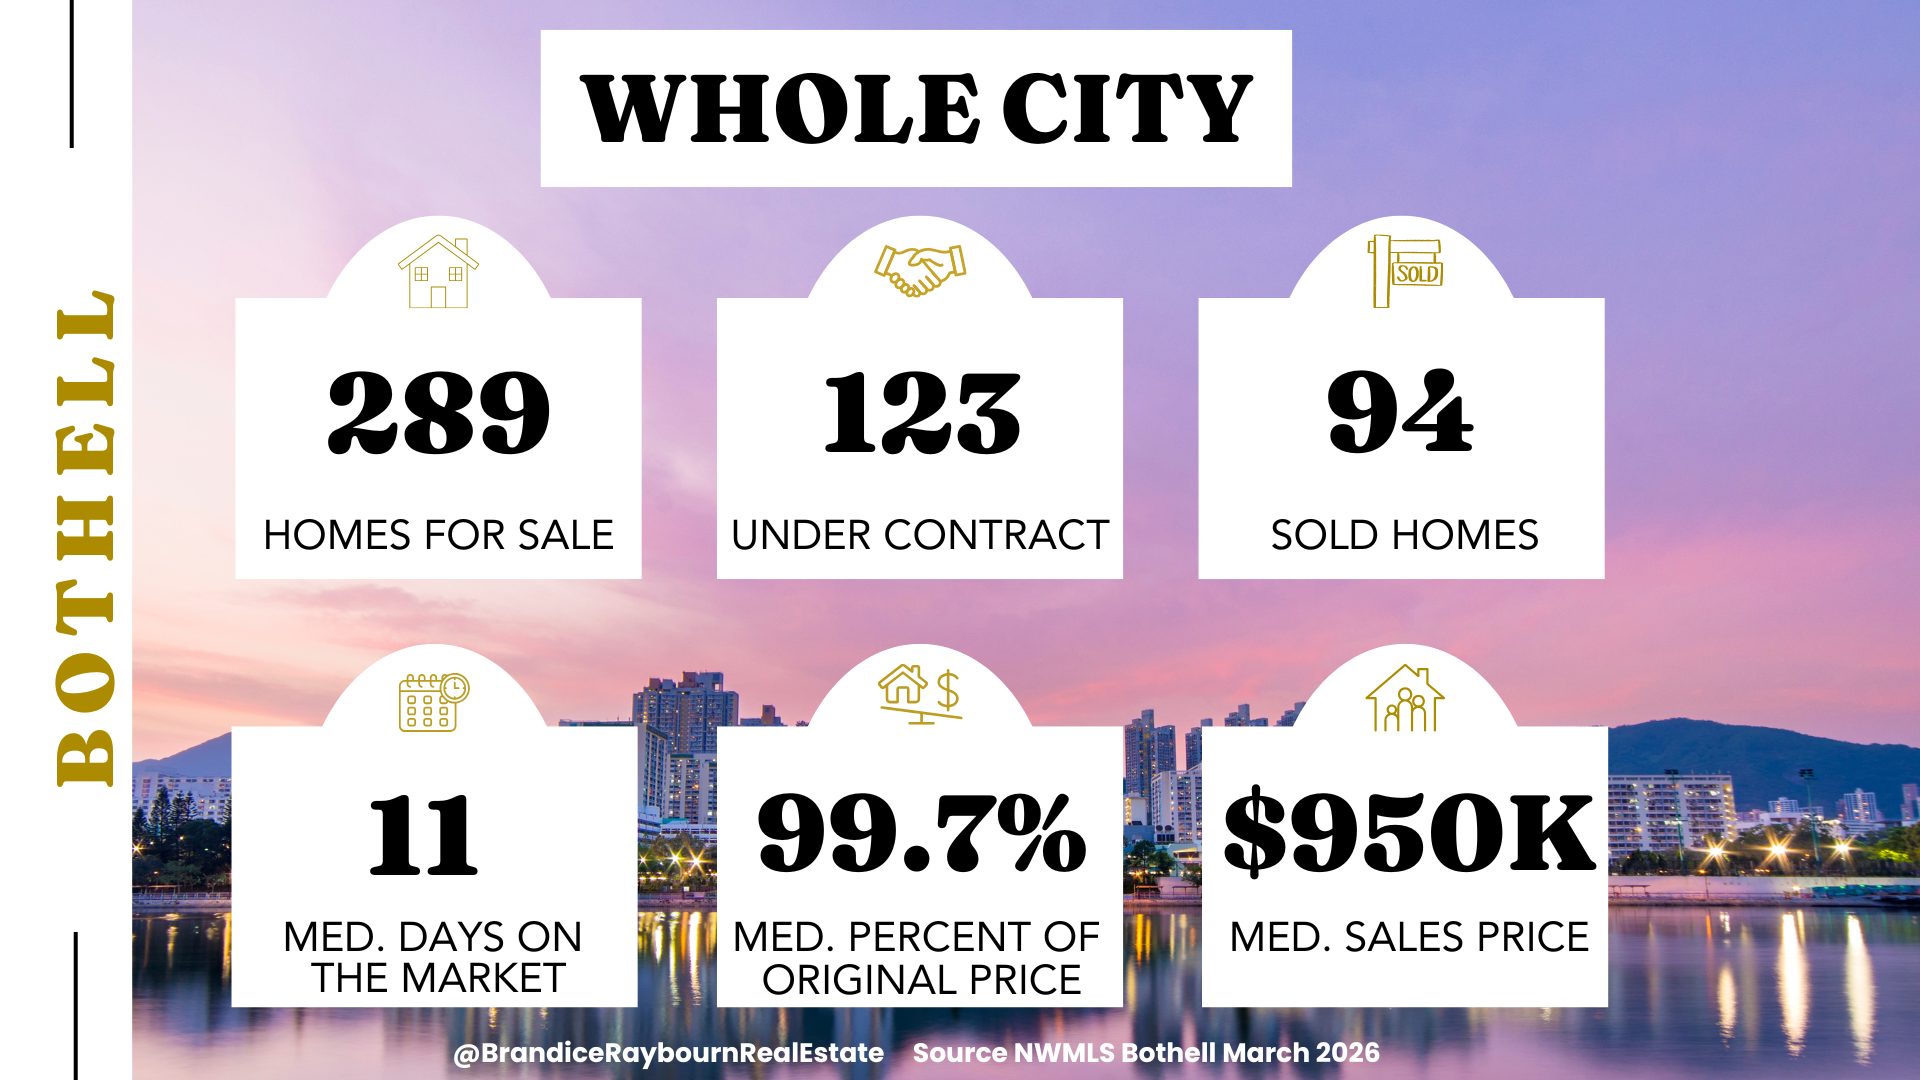
Whole City
Days on market dropped compared to last month. That tells me we are seeing early spring activity start to show up. Homes are moving.
On the surface, it feels active. Buyers are engaging. Decisions are being made.
The city is sitting just under full original list price. The median sales price jumped again from last month. But that jump is not evenly spread across all price points. New construction had a noticeable impact on that number this time around.
When you look at the city as a whole, Bothell feels steady.
When you break it apart, you can clearly see where the real momentum actually sits.
Short on time? You can request a personalized breakdown here.
Source: NWMLS | Analysis by Brandice Raybourn
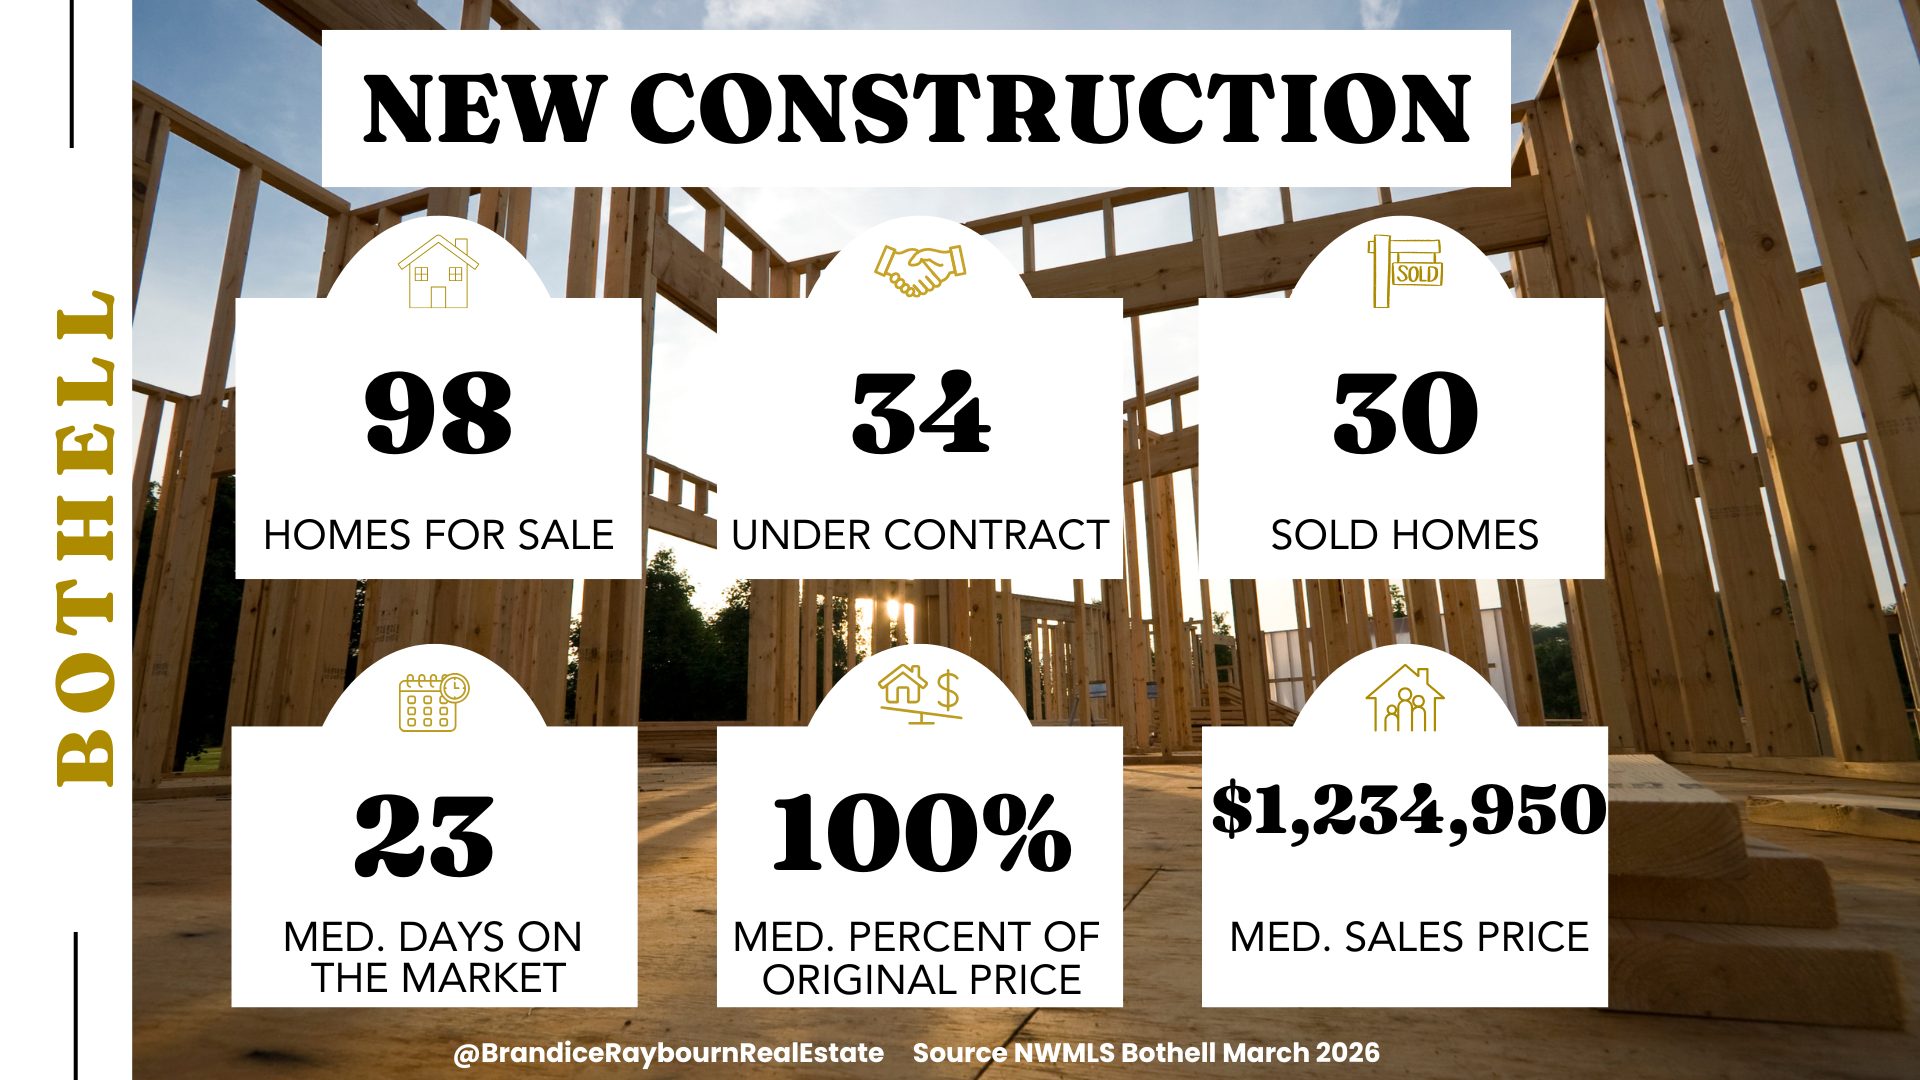
New Construction
New construction had several higher priced closings last month, which pushed the citywide median sales price up.
Builders also had the most homes sold this month compared to any other housing type or price range. So while buyers are not rushing, new construction is still outpacing much of the resale market right now.
Inventory is there. Buyers are looking. And homes are closing.
And do not forget, most builders pay for your buyer’s agent. So bring one with you on your first visit. If you do not have one yet, call me 😉
Source: NWMLS | Analysis by Brandice Raybourn
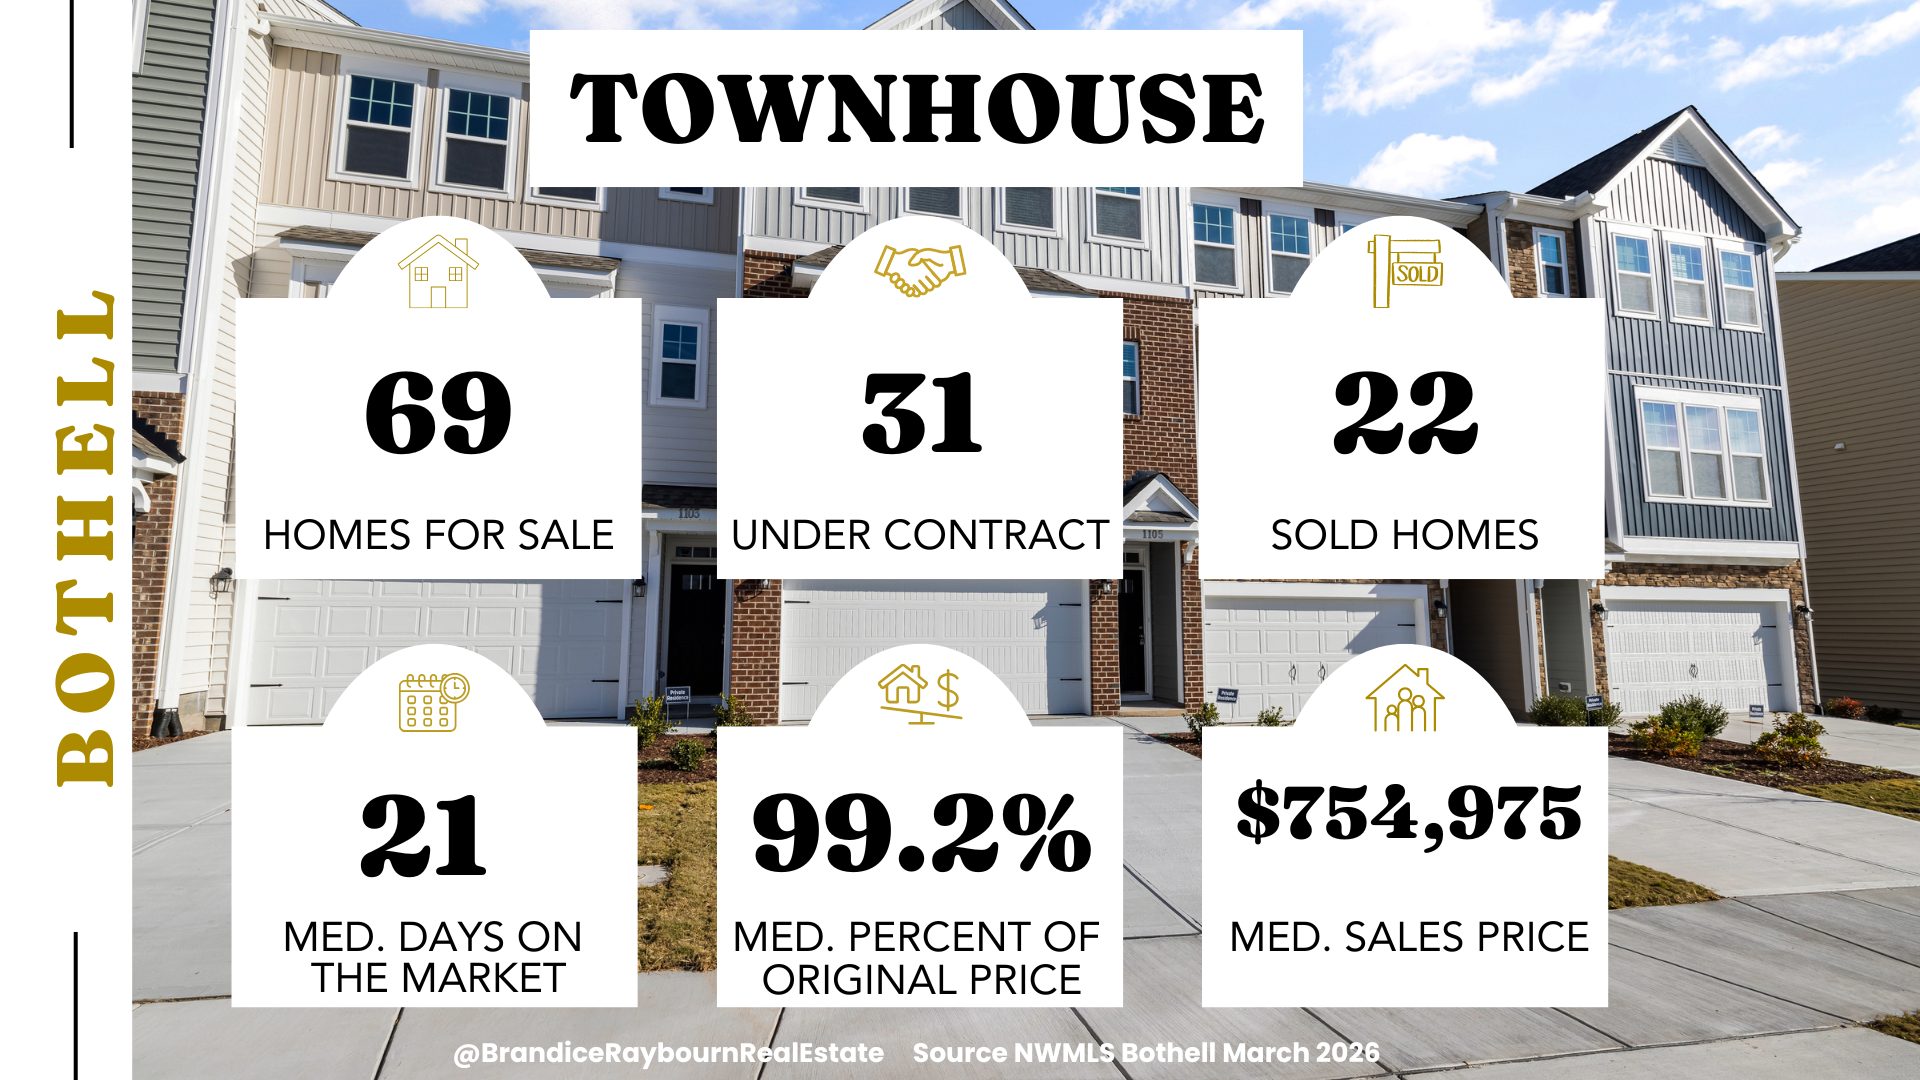
Townhomes
Townhomes feel steady right now. There are plenty to choose from throughout the city as well, and nearly half of them are new construction, which is outpacing the whole city right now.
Sellers are not seeing wild over-list results, but they are not being pushed far under either.
This range feels balanced. Sellers, if you have a townhome, just know that you are competing with the most competitive part of the market right now, which is new construction.
Source: NWMLS | Analysis by Brandice Raybourn
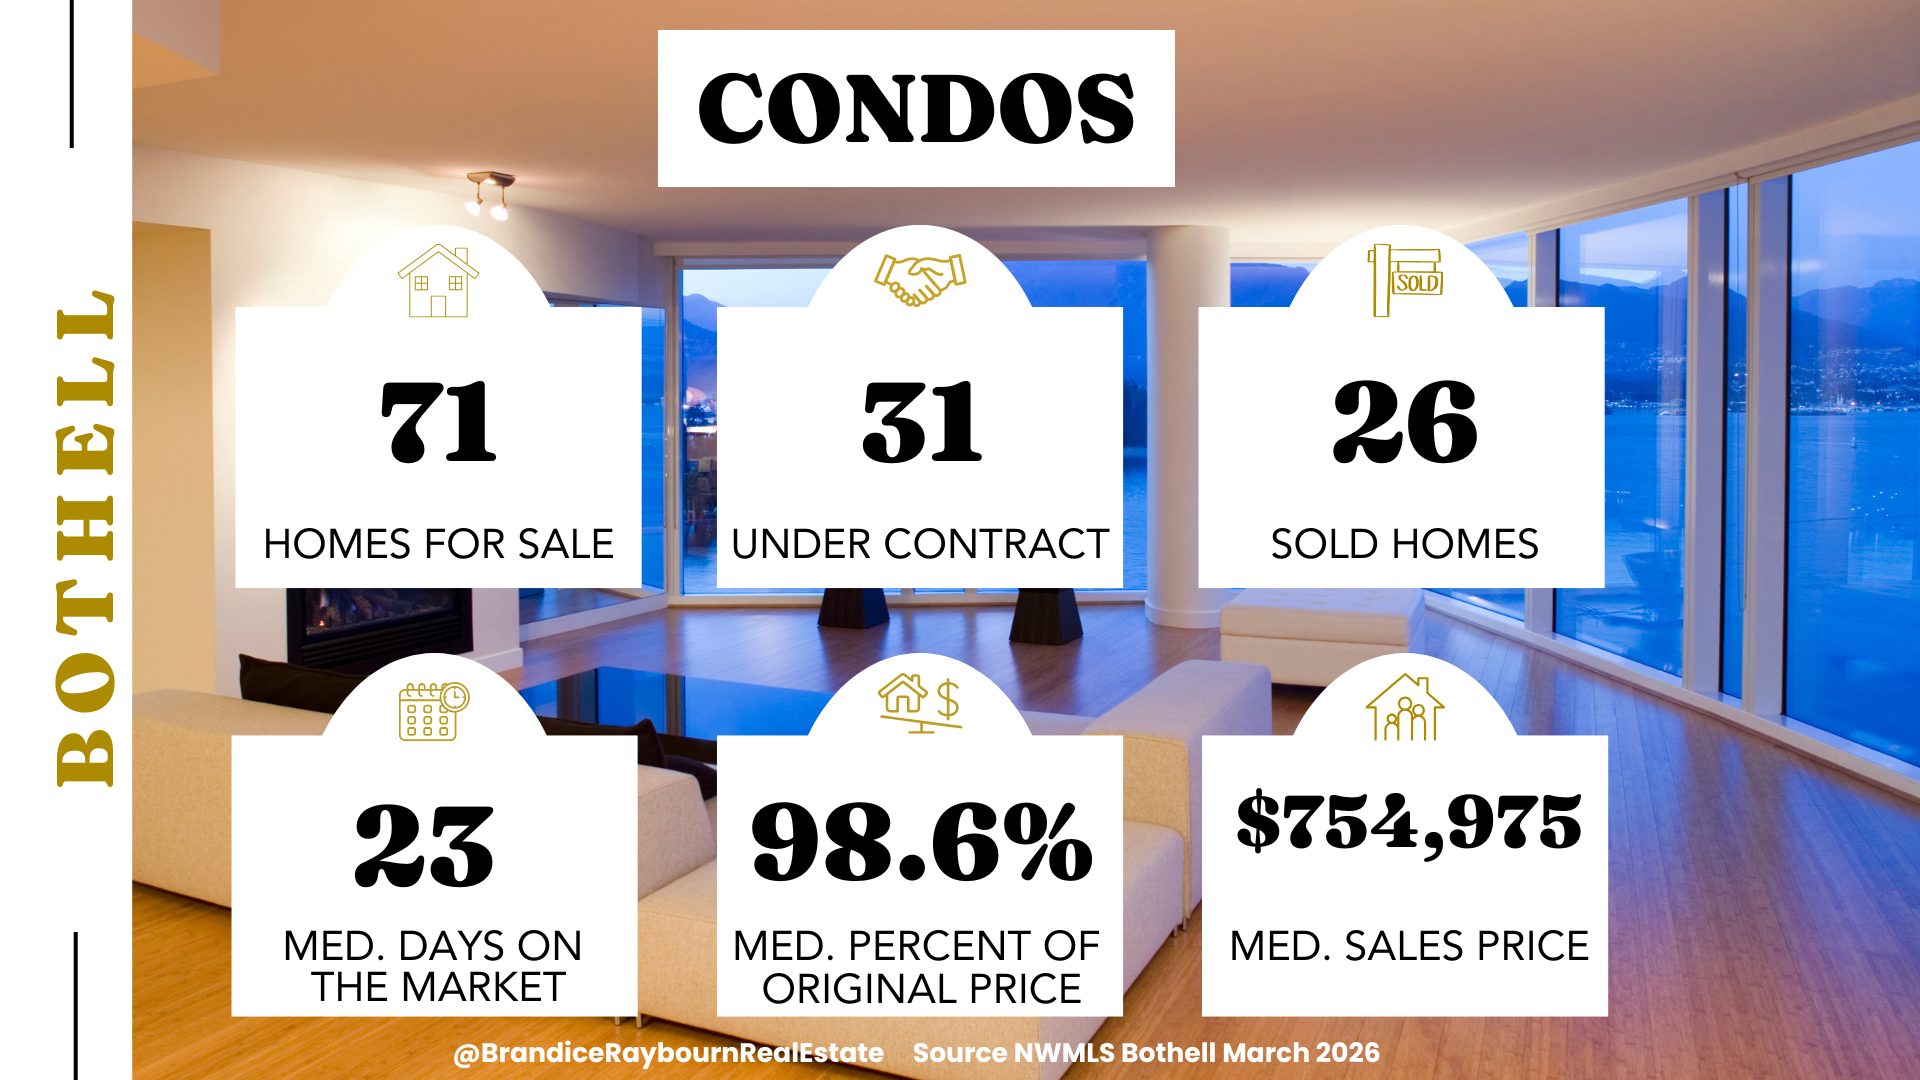
Condos
There is no shortage of condos available in Bothell. This is a good balanced market right now. Sellers are seeing their condos get under contract, but buyers are selective here. HOA budgets, dues, and long-term stability are being reviewed carefully, as buyers should.
Condos are still selling, but they are not as rushed, so pricing and presentation are doing most of the heavy lifting.
Source: NWMLS | Analysis by Brandice Raybourn
Want to See What’s Happening Right Now?
This report shows last month. If you're making a move today, the market has already shifted.
I track what’s happening in real time using the last 14 days of NWMLS activity so you can see exactly what buyers and sellers are doing in your price range right now.
You don’t need another report. You need to know what’s happening before you make a move.
Prefer to reach out directly? Email me here.


Every situation is different. I’ll tailor this to your goals, timing, and what you’re trying to decide.
Residential Resale by Price Point
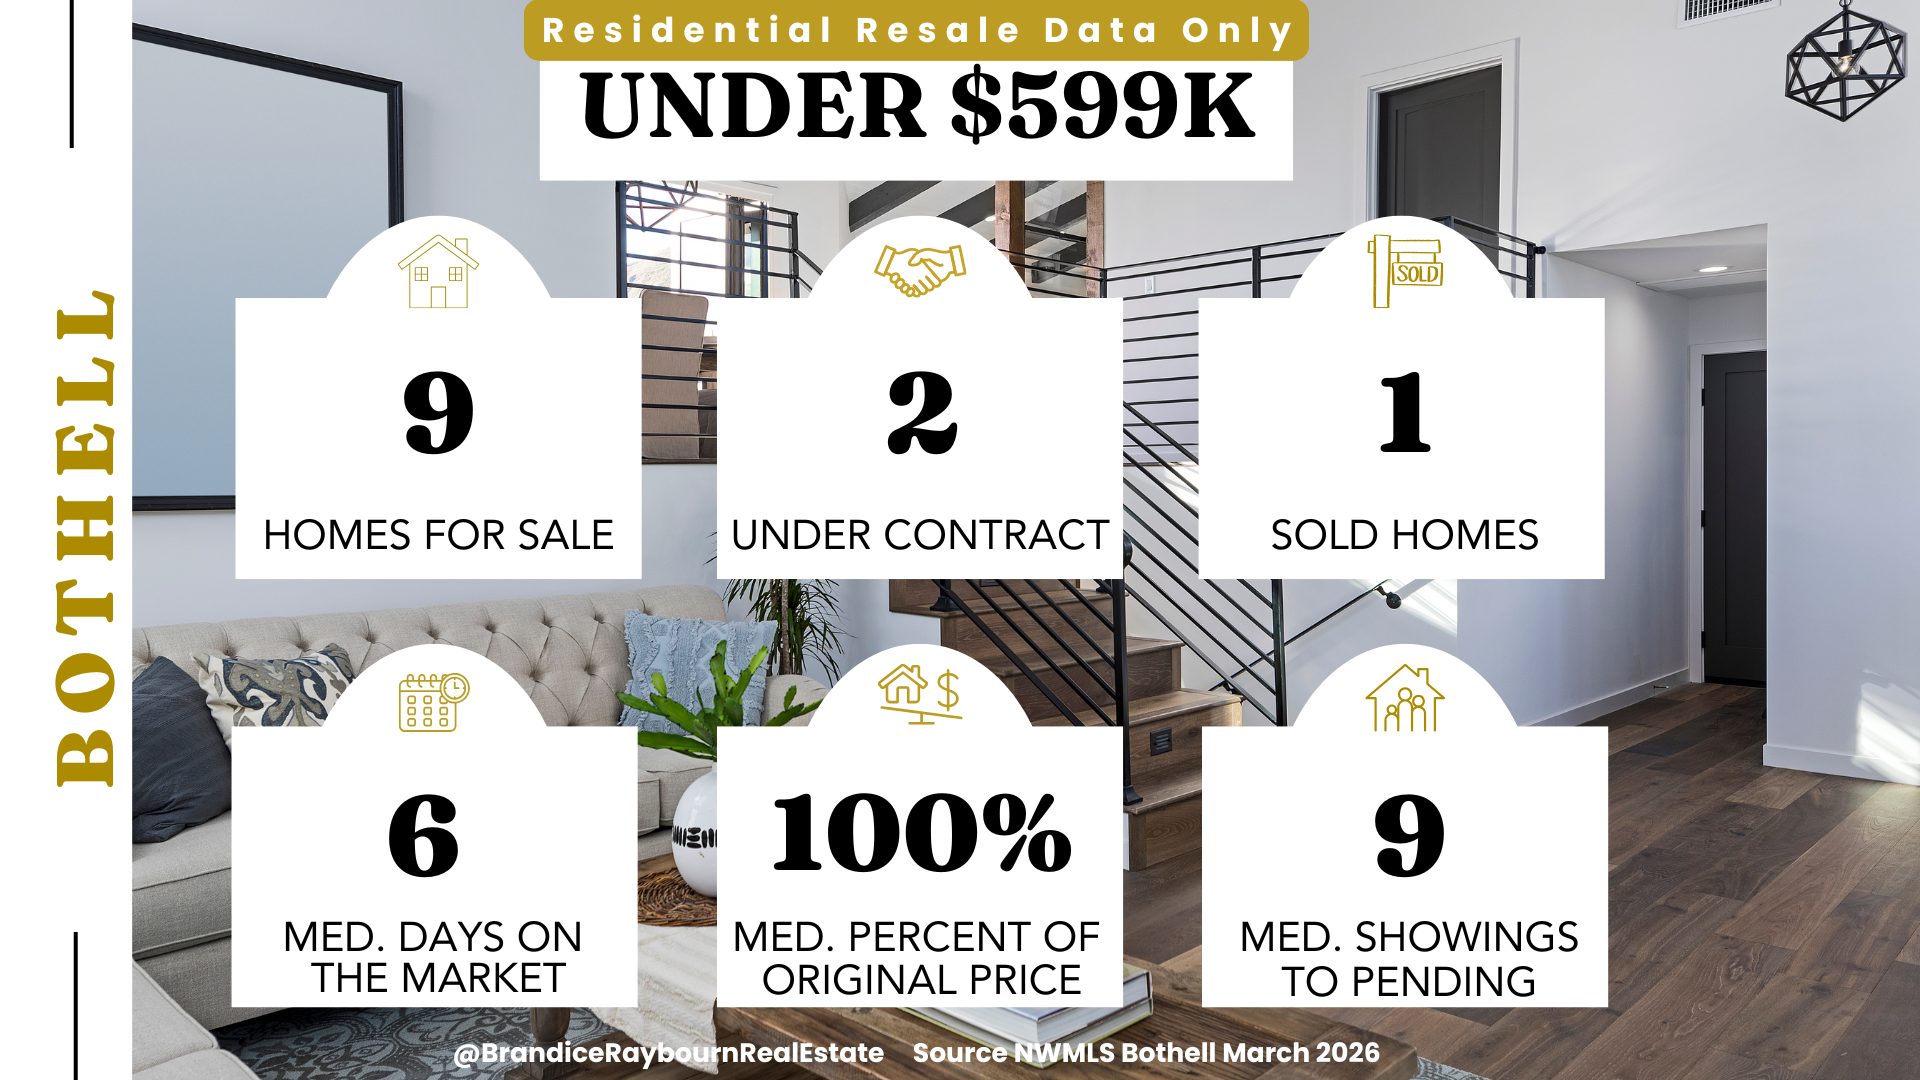
Under 599K Resale
There was only one sale in this range last month.
That is important.
When only one home sells, the entire data set reflects that single property.
In this range, that one home moved quickly and sold at full asking price.
But that does not mean this entire range is suddenly competitive or tight.
It simply means that one home was positioned correctly and buyers responded.
When volume is low, the data can swing dramatically from month to month. This is one of those situations where you need to take the data with a grain of salt.
Source: NWMLS | Analysis by Brandice Raybourn
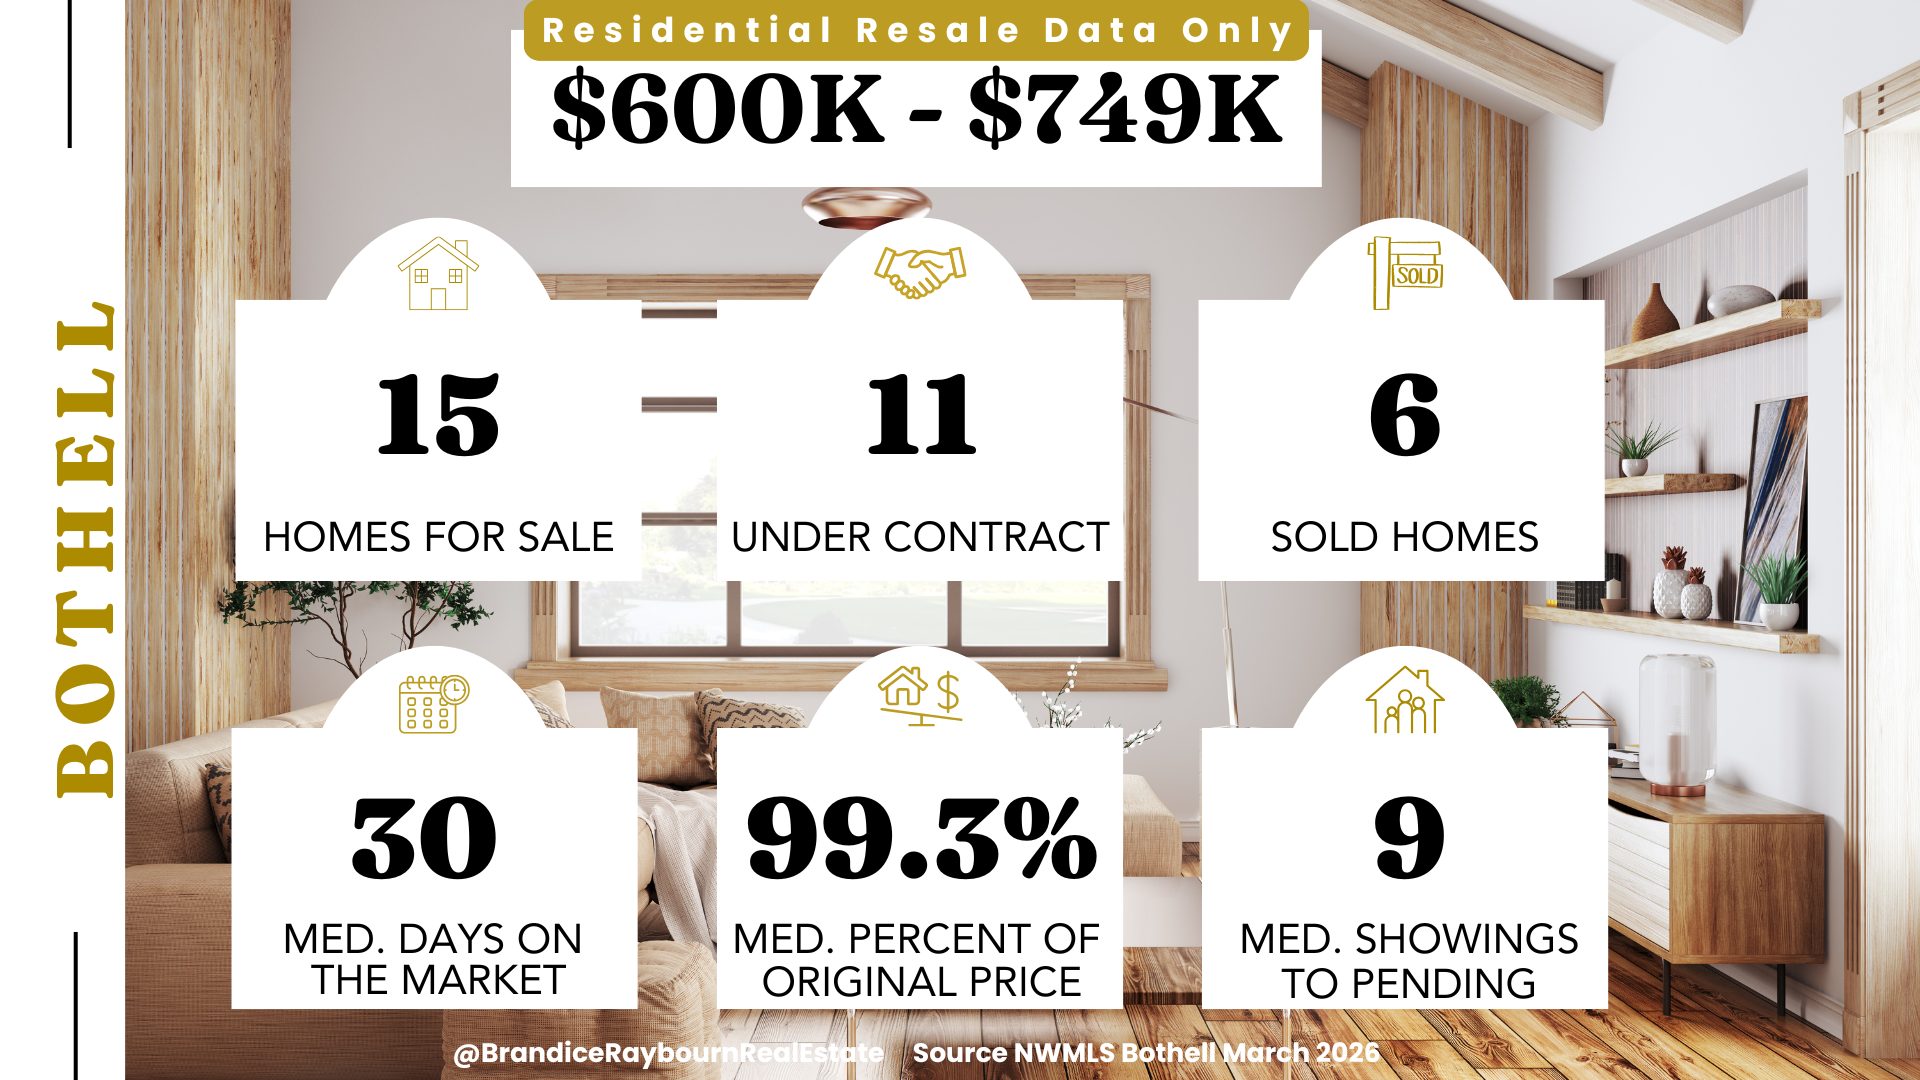
600K to 749K Resale
This is currently the slowest moving range in the city based on days on market, and 30 days is not a long time to be on the market and nothing to be scared of.
Buyers here are taking their time and may even be hoping for a gem to pop up on the market, which sometimes it really does.
They have options. They are comparing. They are not rushing to compete.
Homes are still selling, but sellers in this range need to be realistic about pacing and pricing. This is not the most competitive pocket right now.
Source: NWMLS | Analysis by Brandice Raybourn
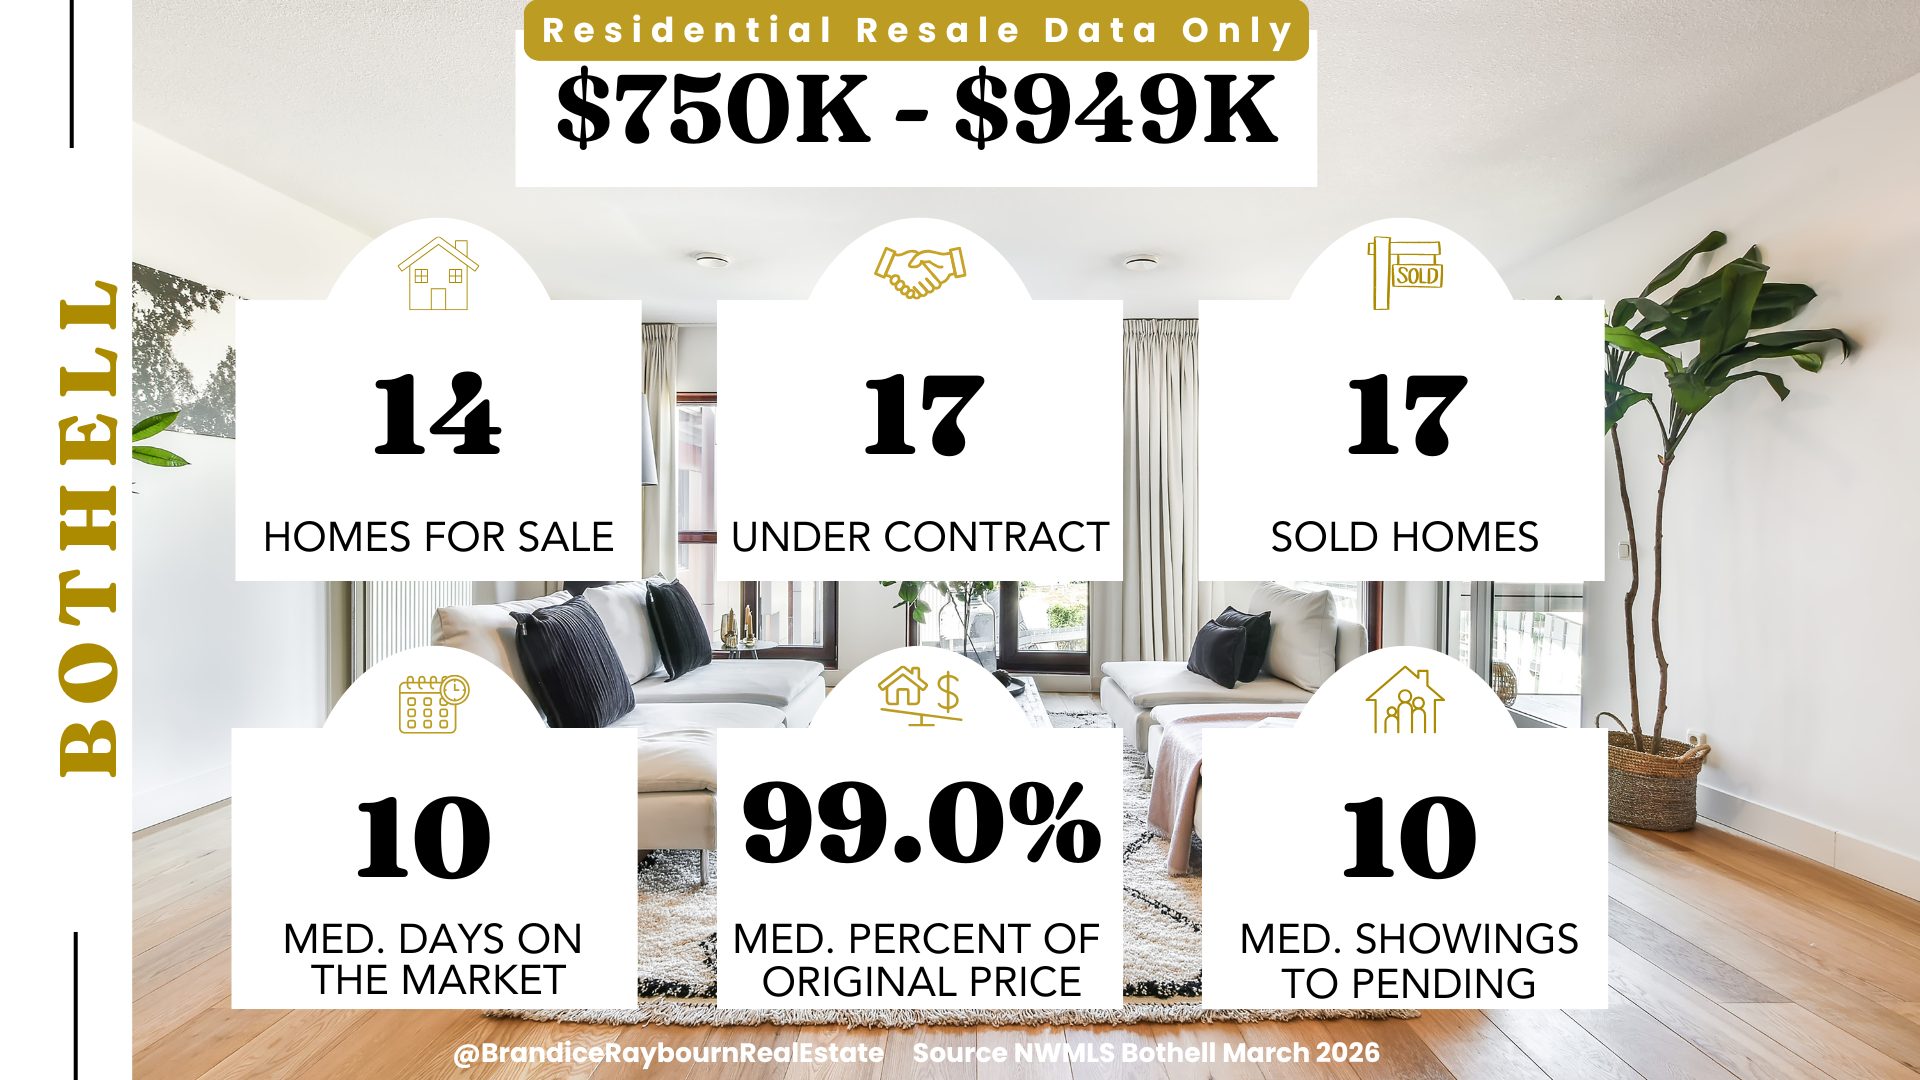
750K to 949K Resale
Buyers are serious here and fast moving. When homes are priced well and show well, they move quickly. Based on the 17 sold properties last month, this is a very good market in this price range. Buyers are putting in offers, and sellers are getting nearly what they originally listed for and not having to wait too long before they receive an offer. This is a good market to be in.
Source: NWMLS | Analysis by Brandice Raybourn
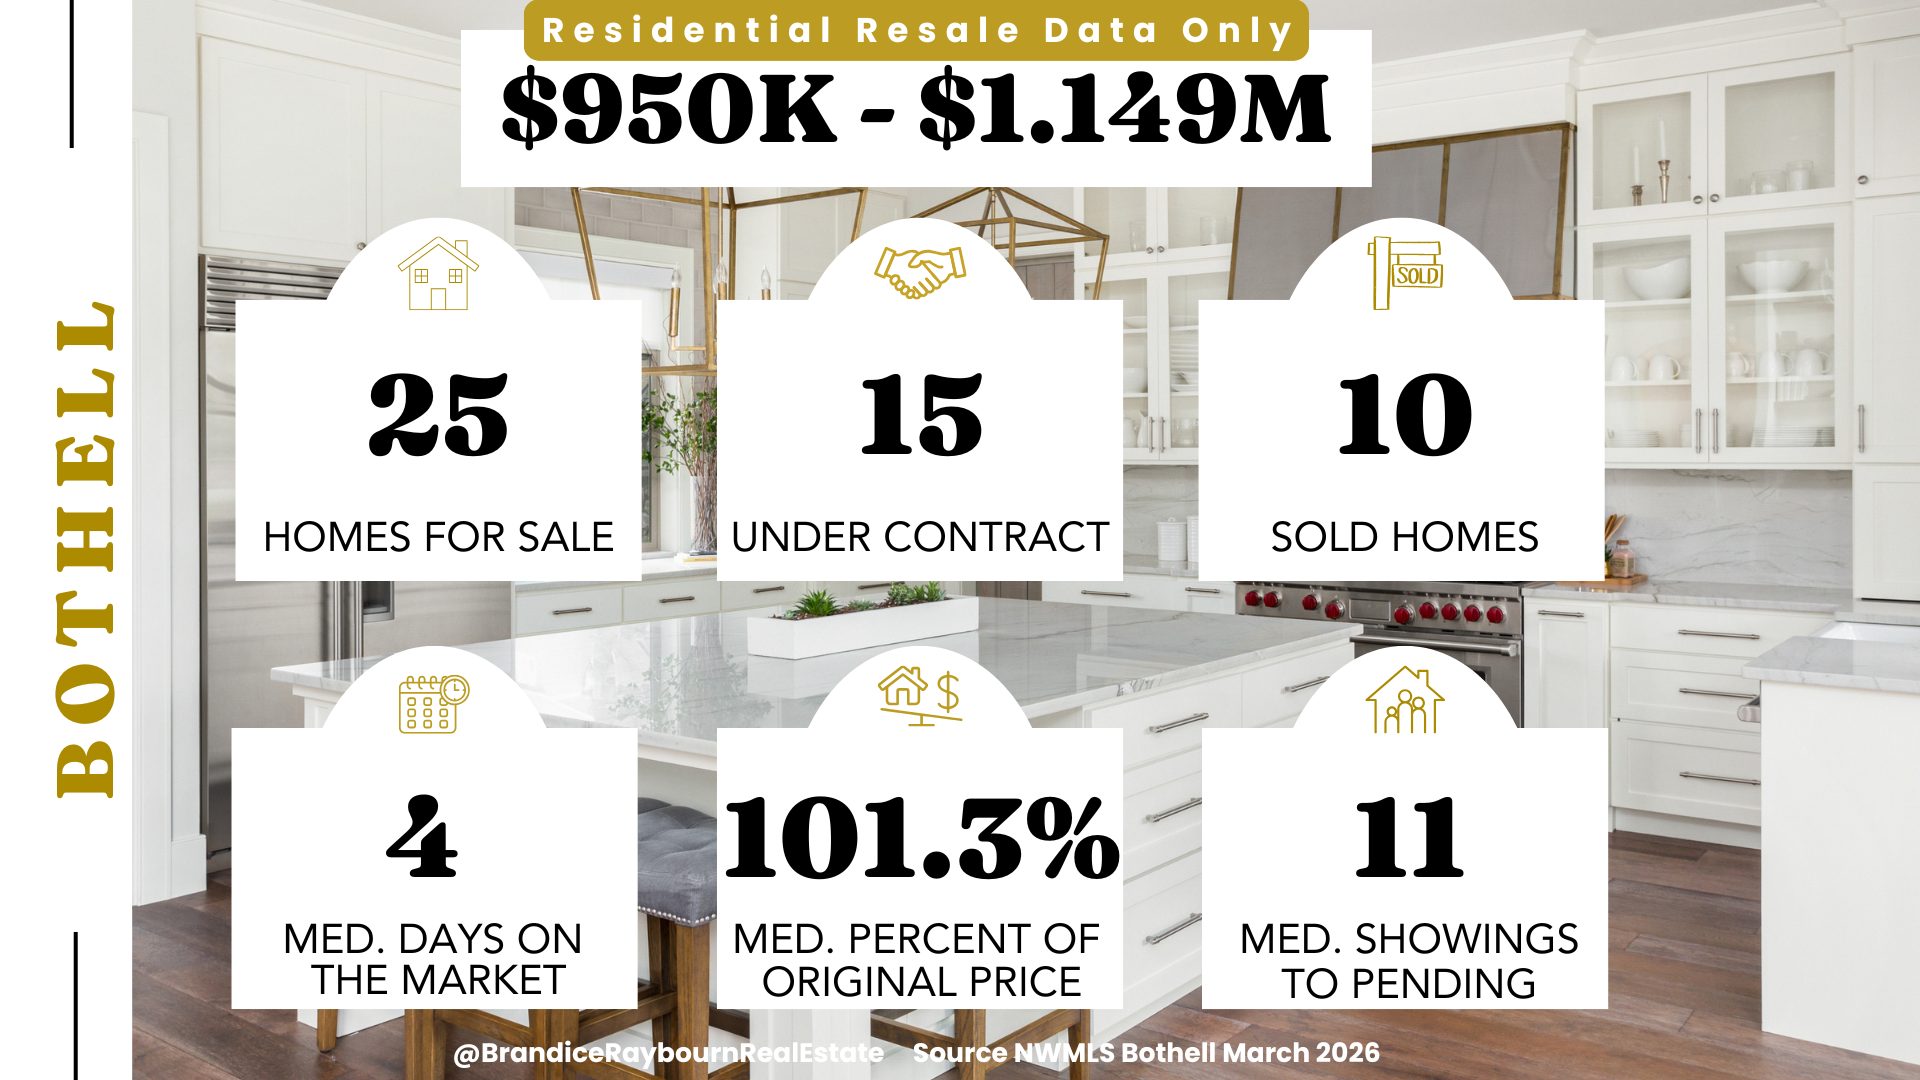
950K to 1.149M Resale
Now let’s move into the belle of the ball for some sellers right now. This is the price range that is making the rest of the city look like sellers are getting nearly 100 percent of their list price. It has also been a minute since I have seen the stat over 100 percent like this.
That sounds dramatic, but it is being influenced by a few very strong sales.
A couple of homes sold well above asking and moved very quickly, within one day. That strength pushes the overall percentage up and the overall days on market down.
At the same time, not every seller in this range sold above list price or even that fast.
This is also where pricing strategy plays a role. Sometimes homes are intentionally listed slightly below perceived market value to create competition, and it worked on at least two homes last month. When that works, the final price can land above asking. Just so you know, one property sold at 112 percent of list price and another at 105 percent last month, which is great for those sellers.
From the outside, the citywide number makes it look like bidding wars everywhere.
When you break it down, you see that this resale pocket is doing most of the heavy lifting.
Source: NWMLS | Analysis by Brandice Raybourn
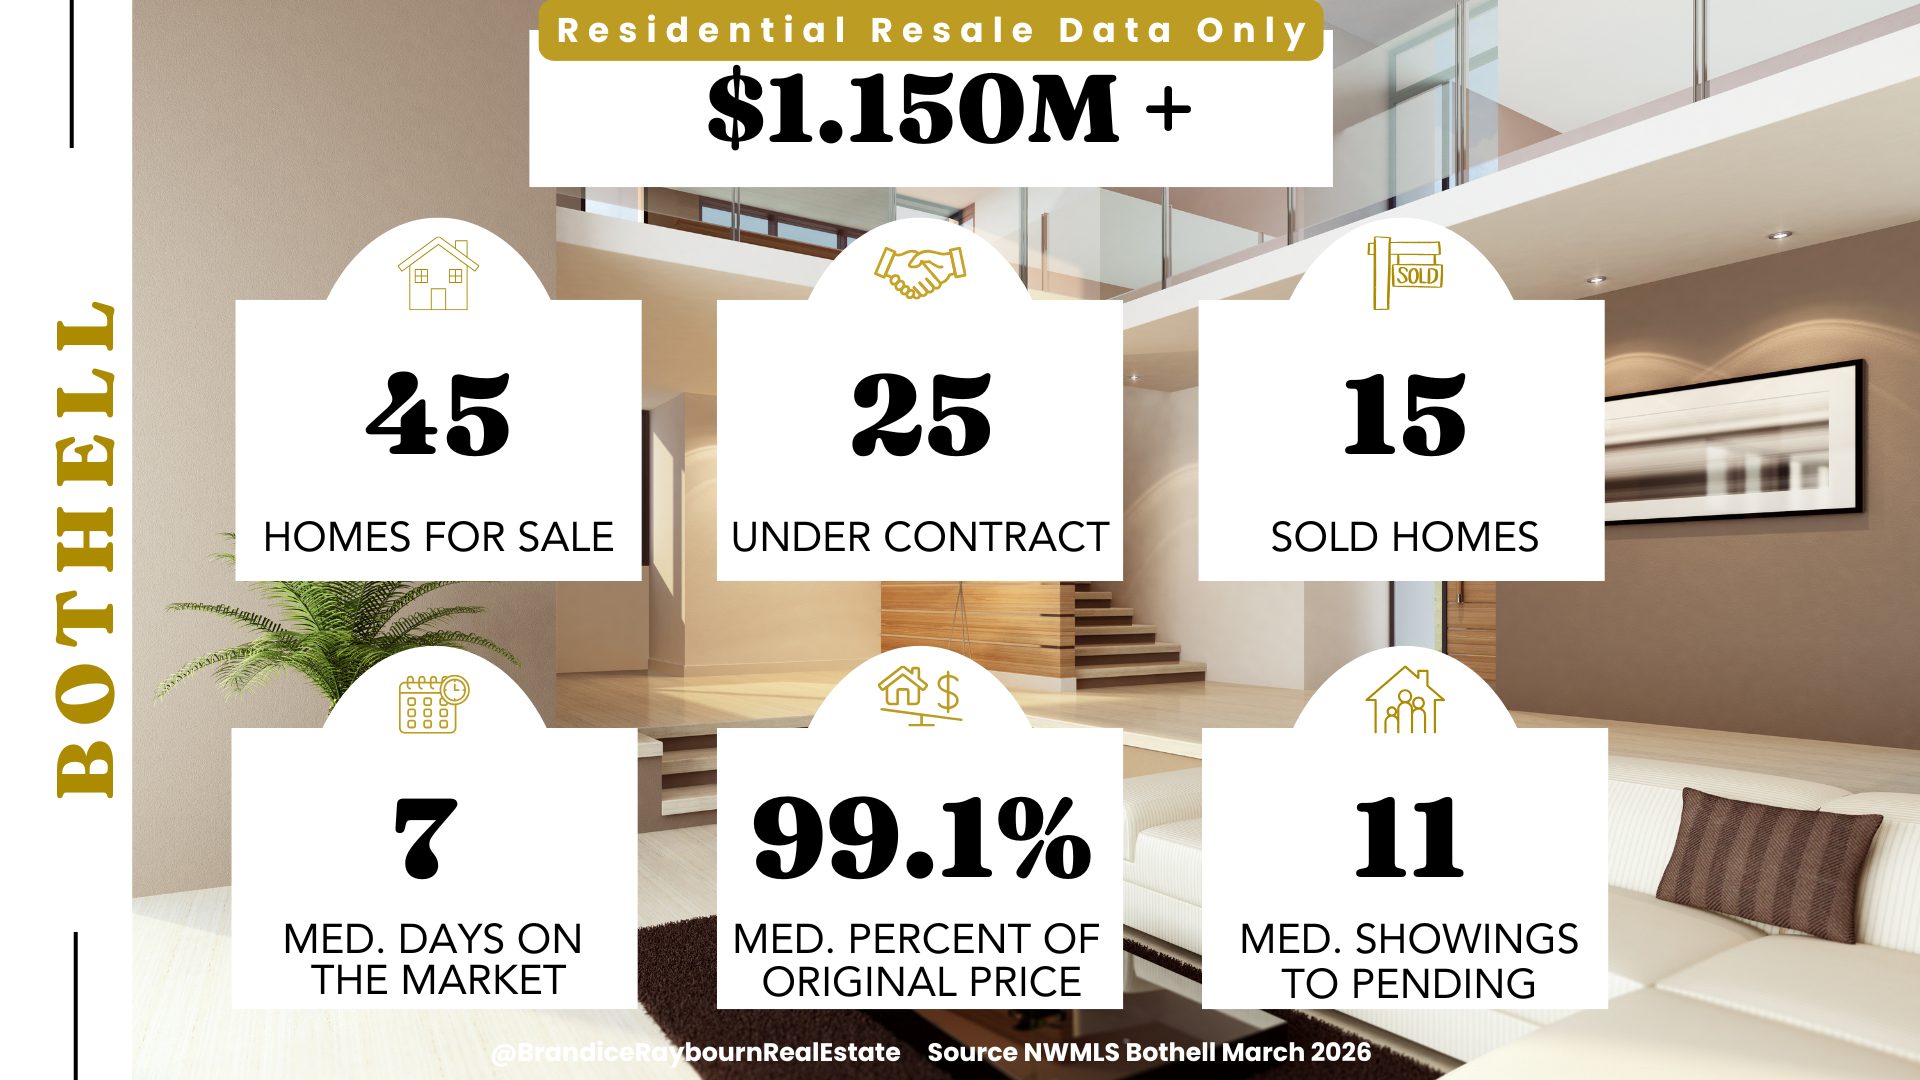
1.150M and Up
Buyers in this range and above are selective but decisive. There is plenty of inventory here, with the third highest number of homes for sale, behind condos and new construction.
Sellers are getting nearly what they listed for and are not having to wait too long to get under contract. This is a healthy market.
When a home aligns with expectations, it moves. When it misses the mark, it sits. Take a look around at your competitors’ homes.
Source: NWMLS | Analysis by Brandice Raybourn
Overall Take on This Market
Days on market is down across the city.
The median price jumped, influenced in part by higher-priced new construction closings.
The city is hovering near full original list price.
But that strength is not evenly distributed.
One range had only one sale.
One range is moving slower than the rest.
One resale pocket is lifting the averages above 100 percent.
One housing type pushed the citywide median price up just from a few higher sales last month.
If you are a seller, look at your competition, especially around your price range and housing type, since buyers typically search by price point first.
Brandice’s Final Thoughts on Bothell
At a glance, Bothell looks strong. Homes are selling quickly, prices are holding, and the numbers look solid. But once you break it down, it becomes very clear that not all of that strength is evenly spread across the market. Certain price ranges and a few specific sales are doing most of the work and influencing the overall numbers.
• Buyer Tip
Do not rely on the overall numbers to guide your decisions. Some price ranges are moving quickly, while others give you more time to evaluate and negotiate. Understanding where your budget falls will change your entire experience.
• Seller Tip
Do not assume the market will carry your price. Some segments are performing very well, but others are slower and more sensitive. Pricing and positioning correctly based on your specific competition is what determines your outcome.
This is exactly why I publish these reports every month. Markets shift. And when they do, the details matter.
You do not need to time the market. You need to understand it.
If you own a home in Bothell and want to know how these numbers impact you specifically, request your free personalized Bothell Snapshot here.

Brandice Raybourn
Coldwell Banker Danforth
Everett Real Estate Broker
brandice@snohomesbybrandice.com
425-367-3881
Recent Bothell Market Reports
If you want to follow how the Bothell market had been shifting at that time, here are the two most recent earlier reports:
See all Bothell market reports here.
Explore More Market Reports
If you want to compare Bothell to nearby cities or browse more of my monthly market updates, you can find all of my reports here:
Relocating to Bothell? Check out my community page here:
Moving to Bothell, WA? Real Estate Insights with Brandice Raybourn
Brandice Raybourn is a data-driven real estate broker providing hyper-local housing market insights across Snohomish County and North King County.
Wondering how this applies to your home or search? Start here:
Bothell Real Estate Questions – March 2026
It depends on the price range.
Across the whole city, homes are going pending in about 11 days, which feels fast on the surface.
But that is not happening everywhere.
Homes in the 750K to 949K range are moving quickly, often in about 9 days.
Meanwhile, homes in the 600K to 749K range are taking closer to 30 to 40 days as buyers take more time and compare options.
So yes, homes are selling quickly in some ranges, but not across the board.
In many cases, yes. But not for the reason most people think.
The city is sitting right around 99.7 percent of original list price, which looks strong.
But that number is being influenced by a specific resale range.
In the 950K to 1.149M range, a couple homes sold well above asking, including one over 112 percent and another over 105 percent of list price.
Those sales pull the overall number up.
Other homes are still negotiating, especially in slower ranges.
It comes down to price range, pricing strategy, and competition.
Some homes are priced to attract multiple offers and move quickly.
Others are competing against more inventory or buyers who are taking their time.
For example, the 600K to 749K range currently has the longest days on market in the city, which tells us buyers there are being more selective and want value for their dollars.
At the same time, stronger demand in other ranges is creating faster sales.
It is neither across the board.
It depends on where you are in the market.
Some ranges are moving quickly with strong buyer demand and little negotiation.
Other ranges are slower, with buyers taking more time and having more leverage.
The overall market feels balanced, but the experience changes depending on price.
New construction played a big role.
Several higher priced new construction homes closed last month, which pushed the overall median sales price up.
Builders also had the most sales in the city, which means they had a strong influence on the overall numbers.
That increase is not evenly spread across all price points or housing type.
It depends on where your home sits in the market.
Across the whole city of Bothell, homes are selling in about 11 days and sellers are getting close to full list price, which on the surface feels strong.
But that experience is not the same in every price range.
In the 950K to 1.149M range, some sellers are seeing very strong results, including homes selling over list price and going pending in just a few days.
At the same time, the 600K to 749K range is taking longer to sell, closer to 30 days, as buyers take their time and compare options.
So yes, it can be a good time to sell in Bothell, but your outcome will depend heavily on your price range, pricing strategy, and how your home compares to what else is on the market.
It depends on what you are looking for and where you are buying.
There are 289 homes currently for sale across Bothell, which means buyers do have options right now.
In some ranges, like 750K to 949K, homes are moving quickly and buyers need to be ready to act.
In others, like 600K to 749K, homes are sitting longer, which gives buyers more time to compare and potentially negotiate.
There is also a lot of new construction available, and builders are actively selling and influencing the market, which can create additional opportunities depending on your goals.
So yes, it can be a good time to buy, but the experience will feel very different depending on your price range and how competitive that part of the market is right now.
View Latest Market Reports


Monthly Market Reports
Relocation & Community Guides
Buyer & Seller Resources

Brandice Raybourn
425.367.3881 | brandice@snohomesbybrandice.com
Coldwell Banker Danforth | Licensed Broker #23033742
Each office independently owned and operated.
You don't need to time the market. You need to understand it.
Follow me
© 2026 Coldwell Banker Real Estate LLC
