Everett WA Real Estate Market Reports - Updated MonthlyMarket Trends November 14, 2025

Everett Housing Market Report | November 2025

Everett Housing Market Report

November 2025
By Brandice Raybourn

Everett’s housing market in November 2025 looks a lot like it did this time last year, but once you break it down by price point, you can clearly see where things are holding steady and where the market is slowing. When you look at the whole city, the numbers point to a neutral market overall. Homes are still selling, days on market are stable, and sellers are still getting close to their original list price. Nothing feels dramatic at the citywide level, but the price points tell a more useful story.

All price point data below reflects residential resale only.

Under 599K

Homes under 599K are holding pretty steady. The median price did not move year over year, but inventory has almost doubled compared to last October. That extra inventory is giving buyers more options and more confidence to slow down. Sellers in this range are landing around 95.2 percent of their original list price, which tells us buyers are negotiating more. Days on market and closed sales are right in line with where we were last year, so while this range is softer, it is still functioning normally.

This price point mostly consists of older detached homes, fixers, and dated properties, with a few newer condos and townhomes mixed in. Buyers are selective here and condition matters more than ever.

600K to 749K

This range is where things pick up. Days on market dropped significantly from last year, which is a huge shift and a clear sign of stronger buyer demand. Inventory stayed almost identical year over year, which means homes are simply moving faster. Sellers are getting right around their asking price and going under contract quickly.

This is a very competitive price point for buyers. The inventory here is made up of solid ramblers, split levels, and well-located homes that offer good value. Buyers move fast when something hits the market that checks the boxes, and sellers benefit from that urgency.

750K to 949K

The 750K to 949K range is basically steady. Prices dipped slightly, inventory bumped up a bit, and days on market stretched from 14 days to 19 days. Sellers are landing around 97.7 percent of their asking price, which tells us there is still demand, just not the same urgency as the lower mid-range.

This range includes move-in-ready detached homes, higher-end townhomes, and some luxury-style properties. Buyers have a little more breathing room than they did last year, but this range remains consistent and predictable.

950K to 1.149M

This price point is holding strong. Inventory is limited, closed sales are down slightly, but homes are moving quickly, often within a week. Prices are trending up and sellers are getting right around their original list price. Even with fewer sales, the demand here remains solid.

Most of the inventory in this range consists of newer construction, newer detached homes, and updated midcentury properties. Buyers shopping here tend to be decisive, which is why this range continues to perform well.
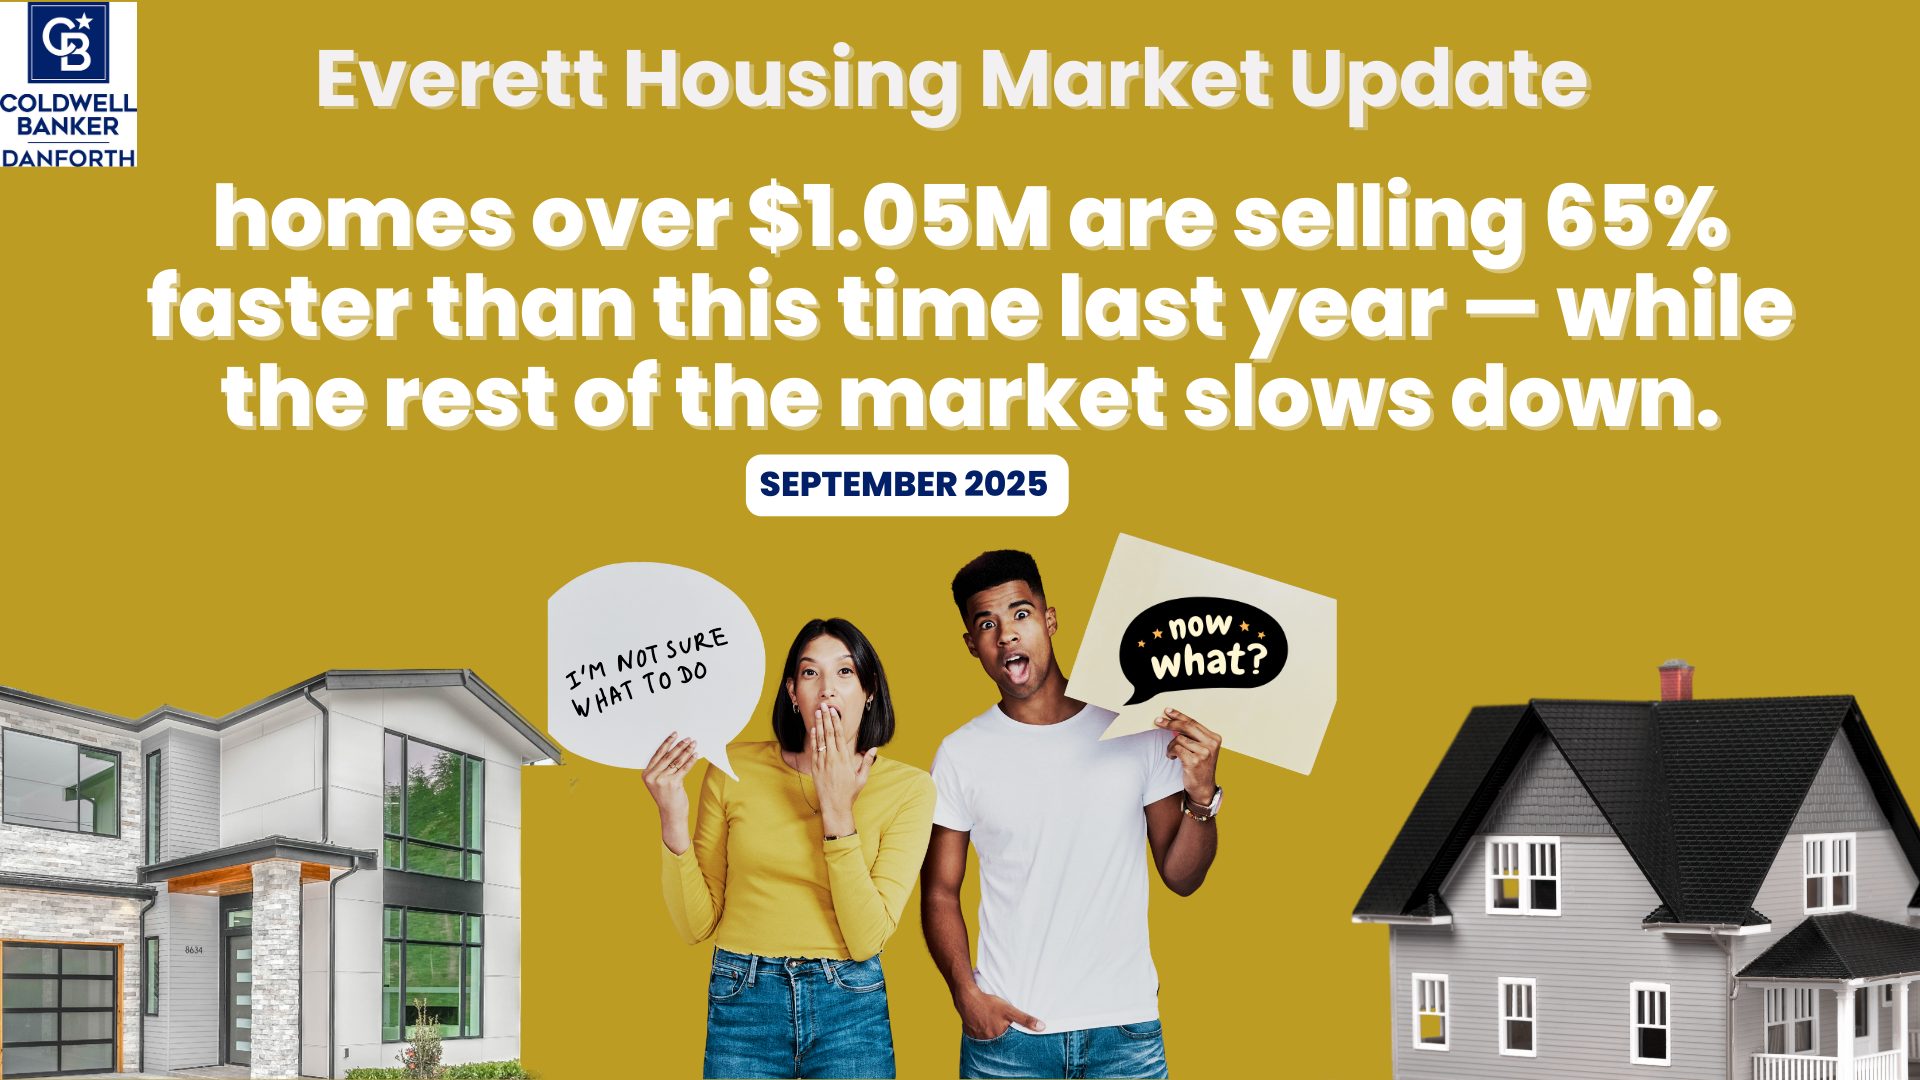
1.15M and Above

There is very little movement above 1.15M. Only two homes sold in October, and with such a small sample size, the price drop looks dramatic but is not especially reliable. Homes are taking longer to sell, with days on market stretching to about 35 days, but sellers are still getting around 96.5 percent of their list price.

This is a slower, more selective market with a smaller buyer pool. Homes can absolutely sell here, but pricing and expectations matter more than anywhere else in the city.

Whole City Snapshot

When you look at Everett as a whole, the median price dip is likely tied to one large sale from last year that did not repeat this year. Outside of that, everything looks pretty steady. Inventory is up, days on market are nearly identical, and sellers are still getting close to their asking price.

Everett is not a market you can judge by headlines or citywide averages alone. Some price points are competitive. Others are slower. That is exactly why breaking the market down like this matters.

You do not need to time the market. You need to understand it.

If you are thinking about buying or selling in Everett and want to understand what this market means for your specific price range, I am always happy to help.

Brandice Raybourn
Coldwell Banker Danforth Everett
brandice@snohomesbybrandice.com
425-367-3881

Relocating to Everett. Check out my community page here: Moving to Everett, WA? Real Estate Insights with Brandice Raybourn

Bothell Market Report - Updated MonthlyMarket Trends November 8, 2025

Bothell Housing Market Update November 2025

Bothell Housing Market Update

November 2025 Residential Resale Only

The Bothell market is still moving, just not evenly across every price point. When you break it down by price tier, you can actually see where the activity really is and where things are slowing. This is why you do not need to time the market. You need to understand it. And in Bothell right now, each price range is telling a completely different story.

I have included my full video breakdown below, but here is the deeper insight into what is happening behind the numbers.

Closed Sales: A Very Mixed Month

Bothell had sixty three closed sales last month, but that total does not reflect an even market. Sales activity was all over the place depending on the price tier.

Under seven hundred forty nine thousand
Only seven homes closed in this range. This is a small segment of the Bothell market and it continues to shrink because of limited inventory and rising property values over time.

Seven hundred fifty thousand to one million forty nine thousand
This is the busiest and strongest segment in the entire city. Thirty three homes closed, which is almost forty percent higher than last year. Buyers are still circling this range and it continues to be the most competitive part of the market.

One million fifty thousand to one million two hundred ninety nine thousand
Thirteen homes closed. Demand is softer than last year and buyers are more cautious. This range is busy but not overheated.

One million three hundred thousand and above
Ten homes closed. This is the range pulling the citywide numbers downward. Fewer higher priced homes closed this year, which makes the overall median price for Bothell look like it dropped more than it actually did.

Year over Year Change: Why the Data Looks So Extreme

When you look at the percentage change from last year, some of these numbers look dramatic. But this is a perfect example of why context matters.

Under seven hundred forty nine thousand
Closed sales are down about thirteen percent. Again, this is a very small segment of the market.

Seven hundred fifty thousand to one million forty nine thousand
Sales jumped thirty seven point five percent. This is the price tier driving the Bothell market right now.

One million fifty thousand to one million two hundred ninety nine thousand
Sales dropped about forty percent. This is not because values fell. It is simply fewer homes selling in this bracket compared to last year.

One million three hundred thousand and above
Sales dropped fifty percent year over year. Luxury activity is quieter, which skews the overall average downward and makes the market look weaker than it truly is.

Median Days on Market: Homes are Taking Longer to Sell

Citywide, homes took a median of twenty five days to sell, which is longer than last year. Here is the breakdown.

Under seven hundred forty nine thousand
A median of twenty eight days.

Seven hundred fifty thousand to one million forty nine thousand
Forty days.

One million fifty thousand to one million two hundred ninety nine thousand
Twenty eight days.

One million three hundred thousand and above
Seventeen days.

Longer days on market mean buyers have more leverage across most ranges. You can take your time, negotiate stronger terms, and explore more options. Even in a slower market, well priced and move in ready homes are still selling quickly.

Median Sales Price: Why The City Looks Down Fifteen Percent

The citywide median appears to be down about fifteen percent year over year, but this is mostly due to fewer high end properties selling this year compared to last year.

Under seven hundred forty nine thousand
Six hundred five thousand.

Seven hundred fifty thousand to one million forty nine thousand
Eight hundred eighty thousand.

One million fifty thousand to one million two hundred ninety nine thousand
One million ninety nine thousand.

One million three hundred thousand and above
One million four hundred forty seven thousand.

Almost every range is holding steady or appreciating slightly. The only thing dragging the whole city number down is the shift in the mix of homes being sold.

Median Percent of Original Price: What Buyers Are Actually Paying

Citywide, homes are selling around ninety six percent of their original list price. Here is how each price range performed.

Under seven hundred forty nine thousand
Ninety seven point nine percent.

Seven hundred fifty thousand to one million forty nine thousand
Ninety six point seven percent.

One million fifty thousand to one million two hundred ninety nine thousand
Ninety nine point eight percent. This is the tightest and strongest tier when it comes to pricing power.

One million three hundred thousand and above
Ninety one point eight percent. More negotiation power for buyers in this tier.

Homes for Sale: Buyers Finally Have Options Again

Inventory in Bothell is up across nearly every range.

Under seven hundred forty nine thousand
Sixteen homes for sale.

Seven hundred fifty thousand to one million forty nine thousand
Sixty five homes.

One million fifty thousand to one million two hundred ninety nine thousand
Forty two homes.

One million three hundred thousand and above
Forty six homes.

More inventory means more choices for buyers and more competition for sellers. Pricing and presentation matter more than ever.

What This Means for You

If you are selling

Buyers are more cautious. You need to price strategically from day one. You also need strong marketing and clean presentation because the best priced and best conditioned homes are still moving quickly.

If you are buying

You have leverage in almost every price tier. Take your time, negotiate better terms, and explore your options. Just remember that the best homes still attract multiple offers even in a slower market.

If you want a personalized price point breakdown for your home or neighborhood, email me anytime. Price point matters. Strategy matters. Understanding where you fall in this market will make all the difference.

Market TrendsMarysville Market Reports - Updated Monthly November 4, 2025

Marysville Housing Market Update | November 2025

Marysville Housing Market Update | November 2025

By Brandice Raybourn

The Marysville housing market in November 2025 looked balanced on the surface, but once you dig into the details, it becomes clear that not all price points are behaving the same way. Homes are still selling, pricing has remained relatively stable, and buyers are active, but the pace has cooled compared to earlier in the year.

This is very much a market where context matters. Some ranges are still carrying the city, while others are slowing down and requiring more patience from sellers.

Marysville Whole City Snapshot

Across the city, closed sales stayed right in line with last year, which tells us demand has not disappeared. Inventory increased compared to the previous year, giving buyers more choices and reducing urgency. Days on market ticked up, which confirms what buyers and sellers are feeling on the ground. Homes are moving, but they are taking longer.

Pricing remained stable overall, with the median price up slightly year over year. Sellers are still getting close to their original list price, but the market no longer rewards overpricing. Buyers are negotiating more confidently, and homes that miss the mark are sitting.

Marysville in November felt steady, balanced, and slower paced.

Under 500K | Residential Resale

Inventory under 500K in Marysville is becoming extremely limited. Even though prices dipped year over year, homes in this range are still selling quickly, averaging about a week on market. That speed is not coming from competition wars. It is coming from a lack of supply.

Buyers in this range are focused on affordability and value. Sellers are not getting full list price as often as they were last year, but demand is still there simply because options are scarce. This range continues to move, even as prices soften slightly.

501K to 749K | Residential Resale

This is where the majority of Marysville’s activity lives. This range has the most inventory, the most buyers, and the most consistent movement. Prices increased modestly year over year, and homes are still selling quickly, typically within two weeks.

That said, buyers are more selective than they were earlier in the year. Homes that are well maintained, well priced, and located in desirable areas perform best. Sellers in this range need to make sure their home stacks up against the competition, because buyers now have options.

This range is carrying the city.

750K to 950K | Residential Resale

This price point tells a very different story. With relatively few sales, year over year comparisons are skewed, which is why the median price appears to be down. That does not mean values are collapsing. It means the data pool is small.

Homes in this range are taking longer to sell, and buyers are more cautious. Even though sellers are still getting close to their original list price, timelines are stretching. Buyers are touring more homes before committing, and negotiations are more common.

This range is slower and requires patience.

950K and Up | Residential Resale

The reality in Marysville above 950K is simple. There is very little activity. Only one home sold in October, and days on market jumped significantly. Pricing increased year over year, but that increase is driven by limited data, not momentum.

Buyers at this level are few and far between, and sellers need to be prepared for long timelines. If you are priced above 950K in Marysville, it is reasonable to expect several months before securing a buyer.

What This Means Going Forward

November 2025 showed a Marysville market that is stable but cooling. The lower and mid price points continue to support the city, while higher ranges slow down and demand patience. Buyers have more breathing room, sellers need to be realistic, and pricing strategy matters more than ever.

You do not need to time the market. You need to understand it.

If you are relocating to Marysville or thinking about buying or selling, check out my Marysville community page here:
Moving to Marysville, WA? Real Estate Insights with Brandice Raybourn

Brandice Raybourn
Coldwell Banker Danforth Everett
brandice@snohomesbybrandice.com
425-367-3881

Lake Stevens Market Reports - Updated MonthlyMarket Trends November 4, 2025

Lake Stevens Housing Market Update | November 2025

Lake Stevens Housing Market Update

By Brandice Raybourn

When you look at the Lake Stevens housing market as a whole, November 2025 shows a market that is active but clearly more measured than last year. Homes are still selling, but buyers are taking their time, inventory is higher, and pricing strategy matters more than ever.

Citywide, the median sales price dipped slightly compared to last year, while inventory and days on market both increased. Sellers are averaging just under original list price, which reflects a shift away from the fast-paced conditions we saw in prior years. This is not a market that is falling apart, but it is one where buyers are more selective and sellers need to be realistic.

That said, Lake Stevens is not behaving like one single market. Each price range is telling a different story, which is why breaking this down by price point gives a much clearer picture of what buyers and sellers are actually experiencing.


Under $600K — Slowing but Still Competitive

The under $600K segment has noticeably slowed compared to last year. Days on market jumped significantly, and sellers are averaging several percentage points under list price. Price reductions are common in this range right now.

Inventory is still limited for detached single-family homes, which keeps competition steady when something well priced comes on the market. Most available options tend to be older homes that need updates, newer townhomes, or mobile homes on land. Buyers are active, but they are cautious and far less willing to overpay.

$601K–$799K — Steady and Balanced

This price range remains one of the most stable segments of the Lake Stevens market. Closed sales, inventory, and days on market are holding fairly close to last year’s pace.

Homes are taking a bit longer to sell, but sellers are still receiving close to original list price when pricing and condition align. This range offers a solid mix of resale homes and newer construction, which continues to attract buyers looking for value without moving into higher price points.

Overall, this segment reflects a balanced market with consistent activity.

$800K–$1.049M — Cooling with Growing Inventory

The $800K to $1.049M range is showing clear signs of cooling. Inventory has increased substantially, days on market have jumped, and closed sales are lower than last year.

Buyers in this range are more cautious and many are sitting on the sidelines, waiting for either better pricing or clearer value. Sellers are facing more competition and need to be strategic with pricing, presentation, and expectations.

This range includes many well-located homes, larger lots, and higher-end finishes, but demand is more selective than it was previously.

$1.05M–$1.299M — Low Competition, Slower Movement

Homes in this price range are taking significantly longer to go under contract, often stretching beyond three months. Buyer competition is low, and sellers are averaging well below original list price.

The one bright spot here is that median prices are still up year over year, showing that value remains strong for the right properties. However, patience is required on both sides, and pricing accuracy is critical.

$1.15M+ — Unique Homes, Targeted Buyers

At the top end of the Lake Stevens market, inventory includes a wide range of unique properties. Buyers have options, including brand new construction, sprawling estates, waterfront homes, and even properties within Frontier Airpark, offering air rights and runway access in Lake Stevens’ aviation community.

This segment attracts a smaller, more targeted buyer pool. Homes are still selling, but sellers should expect longer timelines and thoughtful negotiation rather than quick multiple-offer scenarios.

The Big Picture

Lake Stevens continues to be a desirable place to live, but the market has shifted into a more thoughtful, value-driven environment. Buyers are no longer rushing, and sellers need to understand where their home fits within today’s conditions, not last year’s headlines.

This is exactly why I analyze the Lake Stevens housing market by price point instead of relying on citywide averages. The experience of buying or selling here depends heavily on price range, property type, and positioning.

If you are thinking about buying or selling a home in Lake Stevens and want to understand how this market applies to your specific situation, I’m always happy to talk it through.

Brandice Raybourn
Coldwell Banker Danforth
Everett Real Estate Broker
425-367-3881
brandice@snohomesbybrandice.com

If you are thinking about relocating to Lake Stevens, check out my community page here: Moving to Lake Stevens, WA? Real Estate Insights with Brandice Raybourn

Market TrendsSnohomish Market Reports - Updated Monthly November 4, 2025

Snohomish Housing Market Update | November 2025

Snohomish Housing Market Update | November 2025

by Brandice Raybourn

The Snohomish housing market is doing something that citywide headlines completely miss. It is not acting like one market at all. It is split by price point, and each range is behaving very differently right now. That is why looking at averages alone does not tell the full story.


Snohomish Market Snapshot | Whole City

Across the city, inventory is up and homes are taking longer to sell compared to last year. Sales volume has slowed, which is typical heading into late fall, but prices have not collapsed. In fact, the median sales price is up year over year, and sellers are still walking away with just under full asking price on average.

This creates a misleading picture if you stop here. The real story starts once you look at each price point separately.

Under 600K

This is still one of the most competitive parts of the Snohomish market. Inventory is extremely limited, and when a well priced home hits the market, buyers move quickly. Homes are going pending in about a week and closing right at asking price.

What this feels like in real life is urgency. Buyers need to be ready to tour quickly and act decisively. Sellers still have leverage here, and strong pricing paired with good presentation is enough to attract serious offers without needing to overcompensate.

Affordable options do exist in Snohomish, but there are not many of them, which keeps this range tight.

601K to 849K

This range is still active, but the tone is starting to shift. Inventory has increased compared to last year, and homes are taking a bit longer to sell. Prices are holding, but sellers are no longer pushing past list price.

For buyers, this range feels calmer. There are more options, and you have time to compare homes instead of rushing into the first one that hits the market. For sellers, pricing strategy matters more than it did earlier in the year. Homes that come out too high tend to sit, while well positioned listings still move.

This is where the market starts to reward realism on both sides.

850K to 1.149M

This range has clearly cooled. Fewer homes are selling, inventory has grown, and prices are down compared to last year. Homes are taking close to a month to go pending, and sellers are negotiating more than they were previously.

Buyers in this range have options and they know it. They are comparing condition, layout, location, and overall value very closely. Sellers who want movement need to stand out, either through pricing, preparation, or flexibility on terms.

This range feels slower and more selective, with buyers taking their time and sellers adjusting expectations.

1.050M to 1.349M

This range has stayed relatively steady. Days on market have not changed much year over year, and prices have seen a modest increase. Sellers are still getting close to asking price, and the pace feels stable rather than rushed or stalled.

This part of the market feels balanced. Buyers are thoughtful but active, and sellers who price correctly are still seeing results without extreme delays.

1.3M and Up

This is where the slowdown is most noticeable. Homes are taking significantly longer to sell compared to last year, with days on market stretching out dramatically. Prices are down year over year, and sellers are negotiating more than before.

This range covers a wide variety of homes, but the overall trend is clear. Buyers are cautious, patient, and very value focused. Sellers who are priced too aggressively are waiting, sometimes for months, while those who align with current market conditions have a better chance of finding the right buyer.

This range requires strategy and patience, especially for sellers.

Final Thoughts

Snohomish is a perfect example of why you cannot rely on citywide averages to understand the market. Entry level homes are still moving fast. Mid range homes have softened and favor buyers. Higher end properties are slowing and require a more thoughtful approach.

Price point matters. Strategy matters. And knowing where your home or your budget falls within the Snohomish market will shape your entire experience.

You do not need to time the market. You need to understand it.

If you are thinking about buying or selling above 1.15M in Everett, I can walk you through what this range really looks like right now.
Brandice Raybourn, Coldwell Banker Danforth Everett
brandice@snohomesbybrandice.com
425-367-3881

Relocating to Snohomish. Explore the community guide:
Moving to Snohomish, WA? Real Estate Insights with Brandice Raybourn

Lake Stevens Market Reports - Updated MonthlyMarket Trends October 5, 2025

Lake Stevens Residential Market update October 2025

Lake Stevens Market Update — October 2025

Quick read (what changed):

Closings: 43 total. Most price bands slowed; $1.150M+ was the only bracket up (+33% YoY).

Inventory: 150 active listings (+74% YoY). Biggest jumps: < $600K (+240%) and $850–$1.149M (+113%).

Days on Market: 18 citywide, but a tale of two markets: 5 days < $600K vs 57 days $850–$1.149M.

Prices: City median $750K. YoY by bracket: < $600K +2.0%, $601–$849K +3.6%, $850–$1.149M –9.8%, $1.150M+ +5.5%.

% of Original List Received: 97.5% citywide. Only < $600K is getting over list (101.7%). Most others are selling below list (e.g., $850–$1.149M = 90.5%)

What this means (by stat)
Closed Sales

Sales cooled in almost every price range except $1.150M+ (up 33%). This is less about demand collapsing and more about buyers being choosy and inventory finally giving them options.

Inventory (Homes for Sale)

Active listings rose sharply:

< $600K: +240% YoY — entry-level buyers finally have options.

$850–$1.149M: +112.5% — this is where competition among sellers is strongest.

Whole city: +74.4% YoY.

Days on Market

Fast lane: < $600K = 5 days (still moves quickly).

Slow lane: $850–$1.149M = 57 days (~2 months), $1.150M+ = 13 days.
Marketing time has expanded across most bands, which translates into more negotiating.

Prices

The citywide median is steady at $750K.

The mid-upper ($850–$1.149M) bracket softened (–9.8% YoY).

Entry ($<600K) and luxury ($1.150M+) edged up (+2.0% and +5.5% respectively).

% of Original List Price

Only < $600K gets over ask (101.7%).

Most brackets are below list: $601–$849K = 98.8%, $1.150M+ = 94.6%, $850–$1.149M = 90.5%.

Seller Playbook

Price to your bracket, not the headline.

$850–$1.149M: Expect longer market time and deeper negotiation. Aim for standout presentation, strategic pricing, and strong digital marketing.

$1.150M+: Activity is up and days are short, but the average sale is still below list. Lead with condition and professional marketing to hold the line.

< $600K: Demand is brisk—don’t overreach; clean, move-in-ready homes still win quickly (and sometimes over list).

Use tools that convert: pre-inspection, light prep, thoughtful staging, and rate buydown/concession options to widen your buyer pool.

Buyer Playbook

You have leverage in nearly every range—especially $850–$1.149M, where the average sale is ~9–10% under list and DOM is longest.

< $600K: Move quickly and come prepared—this is the one band that still goes fast and over ask.

Write smarter offers: inspection windows, closing-cost credits, or seller-paid rate buydowns often beat a small price cut.

Thinking of selling or buying in Lake Stevens?
I’ll build you a price-point strategy (not a generic CMA) so you know exactly how your slice of the market is behaving. Call/text 425-367-3881 or email brandice@snohomesbybrandice.com
. Check out my community page: Lake Stevens Community Page

Market TrendsSnohomish Market Reports - Updated Monthly September 30, 2025

Snohomish Housing Market Update — September 2025

Snohomish Housing Market Update for September 2025

The Snohomish market continues to shift, and the numbers show that not every price range is moving the same. If you’re thinking about buying or selling, here’s what you need to know right now.

📊 Closed Sales: A Split Market

There were 97 closed sales in Snohomish this past month, almost flat compared to last year (+1%). But the breakdown tells a very different story.

  • Under $600K: Sales exploded, up 266.7% from last year. Homes in this range are still highly in demand.

  • $601K–$849K: Down 31.9% year-over-year. Buyers here are moving more cautiously.

  • $850K–$1.149M: Sales jumped 68.8%, showing strong demand in this bracket.

  • $1.15M+: Down 12.9%, signaling a slowdown at the very top of the market.

👉🏼 Sellers: If you’re listing above $1.15M, be prepared for a slower pace. Mid-market sellers ($850K–$1.149M) are in a sweet spot right now.
👉🏼 Buyers: Under $600K is still red hot, but you’ll have more leverage in the higher brackets where sales have slowed.

⏱️ Days on Market: Homes Sitting Longer

The median days on market is 17 across the city, up 54.5% from last year.

  • Under $600K: Just 7 days. Homes here are still moving fast.

  • $601K–$849K: 18 days on average, almost double last year.

  • $850K–$1.149M: 21 days, up more than 75%.

  • $1.15M+: 28 days, up 100%.

👉🏼 Sellers: Pricing and presentation matter more than ever. Overprice it and you’ll sit.
👉🏼 Buyers: You’ve got more breathing room in nearly every range — except under $600K, where you’ll need to act quickly.

💰 Median Sales Price: Citywide Increase

The median sales price is $905,000, up 13.9% compared to last year.

  • Under $600K: $564,900, up 4%.

  • $601K–$849K: $745,000, up 7%.

  • $850K–$1.149M: $985,000, up 6%.

  • $1.15M+: $1.38M, up 7.7%.

👉🏼 Sellers: Buyers are still paying, especially in that $850K–$1.149M range.
👉🏼 Buyers: Waiting for prices to drop? That’s not happening across most of Snohomish.

🏡 Homes for Sale: Inventory Rising

There are now 190 active listings in Snohomish, up 17.3% from last year.

  • Under $600K: 12 homes, up 20%.

  • $601K–$849K: 52 homes, up 23.8%.

  • $850K–$1.149M: 55 homes, up 22.2%.

  • $1.15M+: 71 homes, up 11%.

👉🏼 Sellers: More competition means you can’t just list and wait — marketing and pricing are everything.
👉🏼 Buyers: More choices mean less pressure, but the good homes still go fast.

📉 % of Original List Price: Negotiation is Back

Homes in Snohomish are selling for 98.4% of original list price on average, down 1.6% from last year.

  • Under $600K: 100% — sellers are getting their price.

  • $601K–$849K: 97.5%, down 2.9%.

  • $850K–$1.149M: 98.3%, down 1.6%.

  • $1.15M+: 98.7%, down 1.3%.

👉🏼 Sellers: Expect offers to come in under asking unless you’re under $600K.
👉🏼 Buyers: You’ve got room to negotiate in most ranges — but not at the bottom of the market.

✅ Takeaway

The Snohomish market is a tale of two stories: fast-moving homes under $600K and selective buyers above that range. Sellers need to be realistic and strategic, while buyers finally have some leverage back.

Thinking about buying or selling in Snohomish? Let’s talk about how these numbers affect your price range. You can also check out my Community site: snohomish.snohomesbybrandice.com

Bothell Market Report - Updated MonthlyMarket Trends September 21, 2025

Bothell Real Estate Market Update – September 2025

Bothell Real Estate Market Update – September 2025

(Based on August 2025 stats)

The Bothell housing market is sending mixed signals right now. Some price ranges are cooling off, while others are seeing stronger demand than expected. Here’s a full breakdown so you can see where the market stands and what it means for buyers and sellers today.

Closed Sales: Buyers Are Cautious

Overall, closed sales in Bothell are down compared to last year. This shows that buyers are being more selective and taking their time.

👉 The one exception is the $1.05M–$1.299M range, where sales are actually up 29% from last August. That tells us demand is stronger in this price point — likely because it offers more home for the money compared to nearby Eastside cities like Kirkland or Redmond.

Sellers: If you’re under $1M, you’ll need the right pricing and marketing strategy to get noticed. If you’re in that $1.05M–$1.299M sweet spot, demand is stronger, and your home may move faster than you expect.
Buyers: You have leverage in most ranges, but be prepared to move quickly if your budget is in that hot $1.05M–$1.299M zone.

Days on Market: Homes Sitting Longer

Homes are taking longer to sell across most price brackets, especially in the mid-range. In some cases, it’s nearly a month before a seller secures an offer.

Sellers: Patience is key. Price right from the start, or you risk losing even more leverage the longer your home sits.
Buyers: Longer days on market = more room for negotiation. You have time to breathe instead of rushing into an offer.

Median Sales Price: Holding Steady with One Hot Spot

Bothell’s overall median sales price is up 7.6% compared to last year. But the details matter:

  • Under $750K: Prices are down about 10%, likely because fewer lower-priced homes are available.

  • $1.05M–$1.299M: Prices are holding steady with a slight 2.4% increase. This range is carrying the citywide increase.

Takeaway: Not all price points are moving the same way. Sellers above $1M are still in good shape, while buyers under $750K may finally feel a little breathing room.

Inventory: Big Jump Across the Board

Inventory in Bothell is up 119% citywide. At the high end, homes over $1.3M saw the biggest jump — with 168% more listings compared to last year.

Sellers: More competition means your home needs to stand out. Presentation and condition matter more than ever.
Buyers: Finally, more options! But don’t wait too long — well-maintained, properly priced homes are still drawing multiple offers.

Percent of Original List Price: The Real Story

This is the stat sellers can’t ignore. Most homes are selling for under asking, averaging 98–99% of list price. The one exception? Homes under $750K, which are still averaging 100% of asking price.

Sellers: The days of automatic bidding wars are over in most price points. Expect to negotiate.
Buyers: You’ve got leverage to make smart offers — but know where the competition is strong so you don’t miss out.

The Bottom Line for Bothell

The Bothell market isn’t moving in one direction — it depends heavily on the price point.

  • Lower-priced homes (<$750K): Still competitive, sellers are getting 100% of asking.

  • Mid-tier ($750K–$1.049M): More breathing room for buyers, longer days on market.

  • Hot spot ($1.05M–$1.299M): Strong demand, sales up nearly 30%.

  • Luxury ($1.3M+): Inventory is soaring, giving buyers more options than ever.

Whether you’re buying or selling, the key right now is knowing where your price point fits into the bigger picture.  Moving to Bothell, WA? Real Estate Insights with Brandice Raybourn

📲 Want to see how these numbers apply to your home? Let’s chat — I’d love to walk you through it. Call/text me anytime at 425-367-3881.

Everett WA Real Estate Market Reports - Updated MonthlyMarket Trends September 15, 2025

Everett Housing Market Update — September 2025

Everett, WA Housing Market Update — September 2025 (by Price Point)

Quick take: Inventory is up and most homes are still selling very close to list. The mid tier is steady-to-competitive, the $850K–$1.049M band is the slow spot, and the $1.05M+ luxury tier was the surprise mover.

Citywide snapshot

  • Active listings: 175 (+17.4% YoY)

  • Closed sales: 82 (–27 YoY)

  • Median sales price: $757,500 (+5% YoY)

  • Median days on market: 17 (+70% YoY)

  • Median % of original list price: 97.9% (–2.1% YoY)

By price point

Under $549K

  • Active: 27 (+42.1% YoY)

  • Closed: 10 (–33 YoY)

  • Median price: $492,500 (~flat to slightly up YoY)

  • Median DOM: 13 days (+30% YoY)

  • % of original list: 97.4% (–2.6% YoY)
    What it means: More choices than last year and still moving in under two weeks. Buyers get a bit of room to negotiate; sellers should price cleanly and expect offers just under list.

$550K–$849K

  • Active: 86 (+19.4% YoY)

  • Closed: 44 (–34 YoY)

  • Median price: $699,975 (+3% YoY)

  • Median DOM: 13 days (+44.4% YoY)

  • % of original list: 99.3% (~–0.7% YoY)
    What it means: Still a very competitive lane. Well-priced homes sell fast and near list. Buyers should be ready; sellers should prep and price to stand out.

$850K–$1.049M

  • Active: 37 (+12.1% YoY)

  • Closed: 23 (–12 YoY)

  • Median price: $950,000 (+5% YoY)

  • Median DOM: 34 days (+277.8% YoY)

  • % of original list: 97.2% (–2.8% YoY)
    What it means: This is the slow pocket. Buyers have leverage for terms and price; sellers need sharp pricing and standout presentation to avoid extended market time.

$1.05M+

  • Active: 25 (≈ flat YoY)

  • Closed: 5 (+25 YoY)

  • Median price: $1,200,000 (+14% YoY)

  • Median DOM: 17 days (–64.6% YoY, faster)

  • % of original list: 96.0% (+7.4% YoY)
    What it means: Luxury surprised to the upside—faster sales and higher prices year over year. Buyers still negotiate a couple percent; sellers win with tight pricing and great prep.

Bottom line

Everett remains price-sensitive but orderly: most tiers close within 1–3% of asking, and the citywide median DOM is just 17 days. If you want leverage, look at $850K–$1.049M; if you’re selling in $550K–$849K, think “show-ready + right price” and expect quick activity.

Want the same breakdown for your address or price point? Call/text 425-367-3881 or email brandice@snohomesbybrandice.com and I’ll run a quick CMA for you.

Thinking about moving to Everett WA check out my community page: everett.snohomesbybrandice.com/home

PlayPlay
Bellevue Market Reports - Updated MonthlyMarket Trends August 17, 2025

Bellevue Housing Market Update – August 2025

Soon there may be no homes left under $1.1M in Bellevue…

If you’ve been watching the Bellevue real estate market, you know how quickly things can change. And right now, the shift is clear: single-family homes priced under $1.1 million are nearly gone.

This isn’t just a headline—it’s what the numbers are showing us in real time. Let’s break it down.


📊 What the Numbers Say

  • Days on Market: Homes in Bellevue are selling in just 6 days on average, the exact same pace as last year.

  • List-to-Sale Price: Sellers are still getting nearly what they ask, even at higher price points.

  • Price Point Activity:

    • Entry-level ($1.1M and below): Very limited supply, with buyers competing heavily.

    • Mid-tier ($1.2M – $1.6M): Homes are moving at a steadier pace, giving buyers just a bit more breathing room.

    • Luxury ($1.7M+): Surprisingly active—buyers in this range are still willing to move quickly, showing confidence in Bellevue’s long-term value.

What This Means for Buyers

If you’re waiting for prices to come back down, Bellevue may not be the market where that happens. With such low inventory under $1.1M, waiting could push you into a higher price bracket than you planned for.

The good news? Mid-tier buyers still have some room to negotiate, but that window is narrow.

What This Means for Sellers

It’s still a seller’s market, especially at the lower and higher ends. If your home is priced well, you can expect strong activity and offers close to list price and, in some cases, still get over.

My Take

When we look at Bellevue as a whole, it’s clear the lower and higher ends of the market are red hot, while the mid-tier gives buyers just a sliver of room to breathe. Sellers are still in control, but the story varies depending on where your home sits in the market.

Thinking of Buying or Selling in Bellevue?

Whether you’re considering making a move now or just keeping an eye on your home’s value, staying ahead of these shifts is key.

👉 Click here to request your free Equity Assessment (a deeper look at your current home value and options).
👉 Or, if you’re a buyer, let’s talk strategy so you don’t get priced out of the Bellevue market.

Moving to Bellevue, WA? Real Estate Insights with Brandice Raybourn